What is EMG? Surface EMG in research and choosing a sensor
What is EMG? What surface EMG measures, SENIAM electrode placement, signal processing, %MVC normalisation and choosing an EMG sensor for research.
Published
What is EMG, and what does surface EMG measure?
Electromyography (EMG) is the recording of the electrical activity produced as muscle fibres contract; surface EMG (sEMG) measures that activity with electrodes attached to the skin, without needles. In Türkiye the word “EMG” mostly calls to mind a hospital test: needle EMG and nerve conduction studies are diagnostic tests for diseases of muscle and nerve, performed by physicians and interpreted through a physician’s assessment. This article is not about those tests but about surface EMG as used in research: the method that measures when, how much and how a muscle works in ergonomics, sport science, biomechanics, motor control, rehabilitation research and human-computer interaction.
The command that makes a muscle contract comes from motor neurons in the spinal cord. A motor neuron together with all the muscle fibres it drives is called a motor unit. When the motor neuron fires, the electrical wave that travels along its fibres forms the motor unit action potential (MUAP). Surface electrodes do not see a single fibre or a single motor unit; they record the sum of the action potential trains of the many motor units active in the tissue beneath them. On its way through subcutaneous fat and skin this sum is attenuated and its higher frequencies are filtered out. As contraction force rises, both the number of recruited motor units and their firing rates increase; the amplitude of surface EMG is largely the joint result of the two (De Luca 1997).
Properties of the surface EMG signal
Surface EMG is large compared with EEG, but it is still a small signal. The typical values given in textbooks and manufacturer documents are listed below; real values vary with the muscle, the electrode arrangement, the thickness of the subcutaneous tissue and the level of contraction.
- Amplitude
- It can reach a few millivolts in strong contractions; at rest the recording is largely set by amplifier noise and environmental interference. Absolute amplitude in microvolts cannot be compared directly between people or sessions.
- Frequency content
- The usable power typically lies between about 10–20 Hz and 400–500 Hz; most of it is concentrated in a band of about 50–150 Hz.
- Noise and artefacts
- Movement between electrode and skin produces slow fluctuations below 20 Hz, and the mains supply produces narrow lines at 50 Hz and its multiples. Recordings from trunk muscles can also pick up ECG beats.
- Crosstalk
- Activity from neighbouring muscles can reach the electrodes through volume conduction; this has to be taken into account when interpreting small muscles that lie close together.
The sampling rate follows from this frequency content. By the Nyquist criterion, a signal must be sampled at least at twice its highest frequency; for a signal that extends to about 500 Hz, that means at least 1000 Hz. Research systems commonly use 1000–2000 Hz. Resolution (number of bits), input range and the common-mode rejection ratio (CMRR) also determine how well the signal can be separated from mains interference.
Electrode placement and skin preparation: the SENIAM recommendations
Where the electrodes go is one of the decisions that most affects a surface EMG result. The SENIAM project (Surface EMG for a Non-Invasive Assessment of Muscles), run in Europe from 1996 to 1999, examined the variation in methods across publications, published common recommendations for sensors, placement and skin preparation, and worked them out in detail for 27 muscles (Hermens et al. 2000). They remain the most widely used framework today:
- Bipolar arrangement: two recording electrodes are placed side by side along the muscle fibres; the amplifier measures the difference between them.
- Electrode size: at most 10 mm in the direction of the muscle fibres.
- Inter-electrode distance: 20 mm centre to centre.
- Location: according to anatomical landmarks described for each muscle; for the biceps brachii, for example, on the line between the medial acromion and the cubital fossa, at one third of the distance from the cubital fossa.
- Orientation: the electrode pair in the direction of the muscle fibres.
- Reference electrode: on an electrically inactive area; for the biceps, around the wrist.
- Skin preparation: shave the area if it is hairy, clean it with alcohol and wait until the alcohol has evaporated and the skin is dry.
The logic of bipolar recording is simple: common signals that reach both electrodes at the same moment, such as mains interference, largely cancel in the difference, while muscle activity that passes under the two electrodes at different times remains. That is why the skin contact of the two electrodes should be similar; if their contact impedances differ greatly, the common signal cannot be fully suppressed. Placing electrodes directly over the innervation zone, the region where motor end plates are concentrated, can weaken the signal and make it unstable, so placement descriptions avoid that zone (Merletti and Muceli 2019). Reporting the placement, skin preparation, electrode type and spacing in the publication is essential if the study is to be reproducible.
How is an EMG signal processed?
The path from raw EMG to interpretation consists of a few standard steps. Because the choice made at each step (filter cut-off, window length, threshold) changes the result, it should be reported in the publication.
- Band-pass filter: removes movement artefact and DC drift below the EMG band and noise above it; a range such as 20–450 Hz is common. The filter can be applied forwards and backwards to avoid phase shift.
- Mains noise: a 50 Hz notch filter removes the interference but also takes away the EMG’s own power at that frequency, so it is better to fix the source first (cables, grounding, skin contact).
- Rectification: the absolute value of the signal is taken (full-wave rectification), so that positive and negative swings do not cancel in an average.
- Envelope and RMS: the rectified signal is smoothed with a low-pass filter of a few hertz to give the linear envelope; alternatively, RMS is computed in short sliding windows (for example 100 ms). Both follow the intensity of the contraction over time.
- Onset detection: when a muscle switches on is found with a threshold set a number of standard deviations above the mean of a rest period, or with methods such as the Teager–Kaiser energy operator; very short threshold crossings are rejected.
- Normalisation: because amplitude in microvolts depends on electrode, skin and tissue conditions, it is usually expressed as a percentage of the maximal voluntary contraction (MVC). In groups for whom an MVC cannot be performed safely, other references are used; which method to choose depends on the research question (Besomi et al. 2020).
- Fatigue analysis: during a sustained contraction, as muscle fibre conduction velocity falls, the EMG spectrum shifts towards lower frequencies. A decline over time in the median frequency (MDF) or mean frequency (MNF), computed in short windows, is a common indicator of muscle fatigue (De Luca 1997).
The measures these steps produce answer different questions. The table below summarises the ones reported most often; in the analysis lab on this page you can follow the same steps one by one on a synthetic biceps recording.
| Measure | What it tells you | What to watch |
|---|---|---|
| Linear envelope and RMS (µV) | The muscle’s level of activity over time | Cannot be compared directly between people or sessions |
| %MVC | Activity as a proportion of the person’s maximal contraction | The MVC trial must be performed in a standard and safe way |
| Onset and offset times | The order and delay with which muscles switch on | The threshold method and the rest window change the result |
| Median and mean frequency | Fatigue-related spectral shift during a sustained contraction | In dynamic movement, changes in force and joint angle also affect the spectrum |
| Co-contraction ratio | Agonist and antagonist muscles working together | Both channels must be normalised in the same way |
What is an EMG device used for in research?
In research, the answer to “what is an EMG device used for?” is that it shows, quantitatively and independently of visible behaviour, when and how hard a muscle is working. The main areas of use are these:
- Ergonomics and occupational health research
- The load on and fatigue of neck, shoulder and back muscles are compared across workstations, tool use or repetitive tasks.
- Sport science and biomechanics
- Which muscles produce a movement, and in what order, is studied together with force and motion data (goniometer, accelerometer, force platform).
- Rehabilitation research
- Muscle activation patterns are measured in studies of gait, balance and motor control. These measurements are research data; any clinical decision about an individual is made through a physician’s assessment.
- Prostheses and human-computer interaction
- In myoelectric control, EMG patterns are classified to drive a prosthesis, a robot arm or an interface; gesture recognition studies are also part of this field.
- Together with EEG
- The coupling between brain and muscle (corticomuscular coherence) can be studied; in motor imagery studies, EMG confirms that the participant really is not moving.
- High-density EMG
- Tens or hundreds of channels are recorded with electrode grids placed over the muscle; the distribution of activity across the muscle can be mapped and, under suitable conditions, the firings of individual motor units can be decomposed (Merletti and Muceli 2019).
EMG system options for research
Products sold as an “EMG sensor”, an “EMG muscle sensor” or an “EMG device” differ widely in purpose. The table below compares the options by use, not by brand.
| Option | Typical use | Strength | Limitation |
|---|---|---|---|
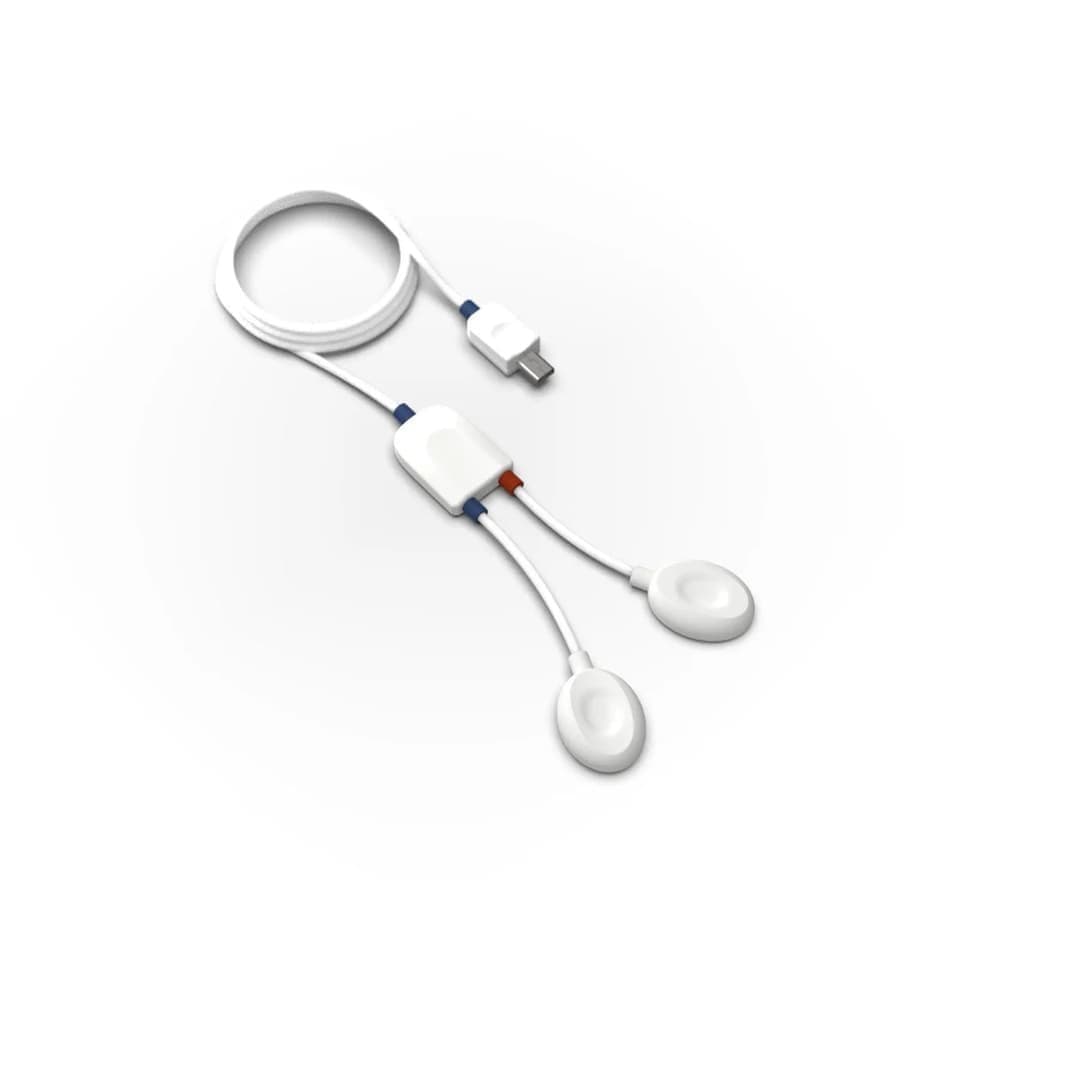
| EMG sensors plugged into a data acquisition hub | Recording a few muscles in the lab, alongside ECG, EDA, force and angle sensors | The sensor mix changes with the experiment; recorded on the same clock as other signals | Cables restrict movement; the channel count is limited by the hub |
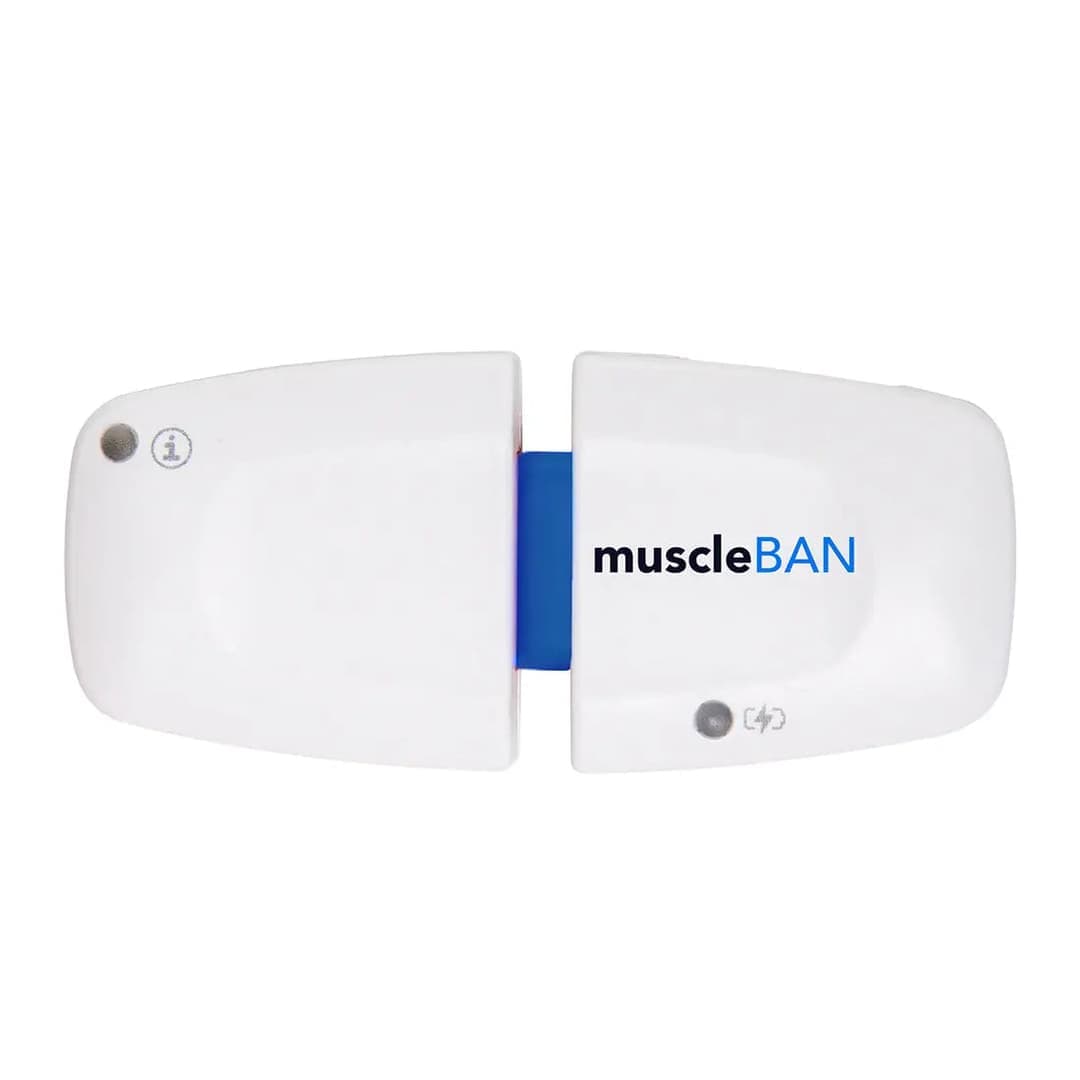
| Wearable wireless EMG devices | Sport, field and ergonomics studies | The participant moves freely; recording to internal memory is possible | Few channels; synchronising several devices must be planned |
| Multi-channel biosignal research kits | Fatigue, workload and stress studies | Several muscles and autonomic signals in one recording | Set-up and analysis need more experience |
| Biosignal channels of an EEG amplifier | Brain-muscle studies, motor imagery, hybrid BCI | EEG and EMG on the same device and the same clock | Few channels are available for EMG |
| High-density EMG grids | Motor unit decomposition, distribution within the muscle, motor control research | Spatial detail; individual motor units can be reached | Needs a multi-channel amplifier, long preparation and advanced analysis |
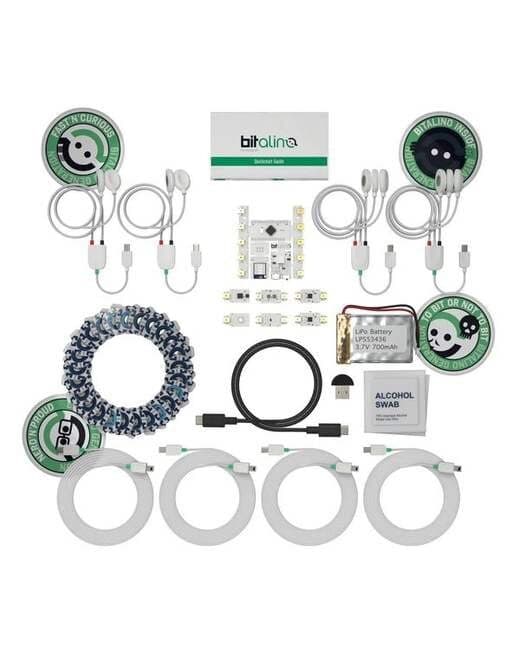
| Teaching and prototyping kits | Biomedical signal processing courses, student projects | Low barrier to entry, open hardware and an API | Their purpose is teaching and prototyping; their specifications must be assessed separately for a research protocol |
What to look for when choosing an EMG device
When writing a technical specification or making a purchasing decision, these questions help:
- How many muscles, and how many channels at once? Will channels be added later?
- Will recording take place in the lab or in the field, and how much will the participant move?
- Are the sampling rate, bandwidth, resolution and CMRR sufficient for the planned analysis, frequency analysis for example?
- Will EMG be recorded on the same clock as EEG, force, joint angle, video or motion capture? Is there a trigger input or a synchronisation path such as Lab Streaming Layer (LSL)?
- Can the raw data be exported, and can you work with your own analysis tools (Python, MATLAB)?
- Are the electrodes disposable, and have consumables been added to the budget?
- How will installation, training and technical support be provided?
These questions also largely determine the price of an EMG system: channel count, whether it is wireless, software and analysis add-ons, and integration with other signals. Nevosa supplies the PLUX and g.tec systems listed on this page and provides installation, training and technical support. For a configuration that suits your study, simply write in the quote form how many muscles you want to record, in what setting and alongside which signals.
Explore the animation
The analysis lab processes a synthetic surface EMG recording from the biceps brachii, sampled at 1000 Hz, step by step: the raw spectrum, a 20–450 Hz band-pass and 50 Hz notch filter, the linear envelope and RMS, onset detection, %MVC normalisation and the fall of the median frequency during a sustained contraction. Change the noise level and compare the result of each step; the data are synthetic and do not come from a real participant.
From raw recording to result, every step computed.
Choose a signal and the analysis runs from start to finish on a synthetic recording built with the noise and artefacts real recordings carry. Every curve, map and number on screen is computed from that data at that step: how much the filter reduced the noise, how much of the blink ICA removed, how the ERP emerges as trials accumulate.
Raw recording
One bipolar pair of surface electrodes over the biceps brachii, placed as SENIAM recommends, recorded at 1000 Hz (research systems often sample at 2000 Hz). The protocol: rest, a 3-second maximal voluntary contraction (MVC), short contractions at about 20, 40 and 60% MVC, then 15 seconds held at 50% MVC. In the zoom, look for the electrode offset, the slow movement artefact as the contraction starts and a small ECG beat; the overview marks a cable spike.
x(t) · bipolar, 1 channel · fs = 1000 Hz · 40 sGenerating the recording and computing the analysis…
Synthetic recording · every value computed from it
Analysis steps · EMG
- 01
Raw recording
One bipolar pair of surface electrodes over the biceps brachii, placed as SENIAM recommends, recorded at 1000 Hz (research systems often sample at 2000 Hz). The protocol: rest, a 3-second maximal voluntary contraction (MVC), short contractions at about 20, 40 and 60% MVC, then 15 seconds held at 50% MVC. In the zoom, look for the electrode offset, the slow movement artefact as the contraction starts and a small ECG beat; the overview marks a cable spike.
- 02
Inspect the raw spectrum
Welch's method gives the power spectrum of the whole recording and of a rest segment. The EMG's power sits mostly between about 50 and 150 Hz and fades towards 450 Hz; movement and drift sit below 20 Hz, and mains interference is a narrow line at 50 Hz, clearest in the rest segment where no EMG covers it. The filters are chosen from this picture.
- 03
Filter
A 20–450 Hz Butterworth band-pass removes the DC offset, drift and movement artefact below the EMG band and the noise above it; a 50 Hz notch removes the mains line. Both run forward and backward, so bursts do not shift in time. The notch also removes the EMG's own power at 50 Hz, which is why some laboratories prefer to remove mains by other means.
- 04
Amplitude envelope
The filtered signal is full-wave rectified and smoothed with a 6 Hz low-pass: the linear envelope. Beside it runs the RMS over a moving 100 ms window. Both follow the force of the contraction; the zoom shows them over the rectified 40% contraction. For a Gaussian signal the ratio of RMS to mean rectified value is √(π/2) ≈ 1.25, which the measured ratio can be compared with.
- 05
Detect onsets
The Teager–Kaiser energy operator emphasises the fast rise of muscle activity over slow artefacts and ECG (Li et al. 2007); its output is rectified, low-passed at 50 Hz (Solnik et al. 2010) and compared with the mean + 8 SD of a rest window, and segments under 50 ms, such as a cable spike, are rejected. The detector reads the band-passed signal before the notch, because a narrow notch rings for a fraction of a second around a strong burst. Below, at the 20% onset, the TKEO is set against a threshold on the envelope alone (mean + 3 SD), and both against the onset that was generated, since the recording is synthetic.
- 06
Normalise to MVC
EMG amplitude in µV depends on the electrodes, the skin and the tissue, so it is expressed as a percentage of the maximal voluntary contraction. The reference is the largest 500 ms moving average of the envelope within the MVC trial. Each contraction's mean envelope over its plateau, clear of the rise and fall, is then divided by that reference.
- 07
Spectral signs of fatigue
As a contraction is held, muscle fibre conduction velocity falls and the EMG spectrum shifts towards lower frequencies (De Luca 1997; Merletti & Parker 2004). The median and mean frequency are computed in 0.5 s windows through the sustained contraction and a least-squares line is fitted to each; the lower left plot overlays the spectra of the first and last three seconds. The amplitude is followed beside them, since fatigue tends to raise it while the force stays the same.
- 08
Amplitude against force
The RMS of each graded contraction's plateau is set against its target level, and a line is fitted through the three. Whether the relation is linear depends on the muscle and the electrode site (Lawrence & De Luca 1983); the MVC point shows how far the line from the graded contractions carries. In a real study force is recorded with a dynamometer beside the EMG; here the target is the level the protocol asked for.
The recordings are synthetic: generated with the known properties of real signals (spectrum, artefacts, response shapes) and the same on every visit. The methods are computed the way their counterparts in common tools (MNE-Python, EEGLAB, NeuroKit2, the HRV Task Force standards, Homer3) compute them. The results belong to a single synthetic participant; they are not a study's finding, a clinical assessment or a device's performance.
Frequently asked questions
What is EMG and what is it used for?
EMG (electromyography) is the recording of the electrical activity muscles produce as they contract. In research, surface EMG shows quantitatively when a muscle switches on, how active it is and whether it is fatiguing. It is used in ergonomics, sport science, biomechanics, rehabilitation research and the control of prostheses or interfaces.
What is the difference between surface EMG and needle EMG?
Surface EMG measures the combined activity of many motor units with electrodes attached to the skin and is widely used in research. Needle EMG records a small region with a needle electrode inserted into the muscle; together with nerve conduction studies it is performed and interpreted by a physician for diagnosis. A clinical question should be taken to a physician.
Where and how is an EMG sensor attached?
Electrodes are placed along the muscle fibres, over the muscle and away from the innervation zone. The SENIAM recommendations describe a 20 mm distance between the two electrodes, an electrode size of at most 10 mm in the fibre direction, and a reference electrode on an inactive area such as the wrist. The skin is shaved if necessary, cleaned with alcohol and left to dry.
What sampling rate does an EMG recording need?
Because the usable power of surface EMG typically extends to 500 Hz, sampling at no less than 1000 Hz is needed. Research systems commonly use 1000–2000 Hz. The chosen rate, bandwidth and filters should be reported in the publication.
How does EMG show muscle fatigue?
During a contraction held at constant force, muscle fibre conduction velocity falls and the EMG spectrum shifts towards lower frequencies. A decline over time in the median frequency, computed in short windows, is a common indicator of fatigue. Amplitude usually rises at the same time; the two are interpreted together.
What determines the price of an EMG device?
The price depends on the channel count, whether it is wired or wireless, its measurement specifications, software and analysis licences, and integration with other signals such as EEG. Teaching kits, single sensors and multi-channel research systems correspond to very different budgets. For a fair comparison, first establish how many muscles, what setting and what analysis the study requires.
References and further reading
- Hermens et al. (2000) · Development of recommendations for SEMG sensors and sensor placement procedures (SENIAM)
- De Luca (1997) · The Use of Surface Electromyography in Biomechanics
- Merletti and Muceli (2019) · Tutorial. Surface EMG detection in space and time: Best practices
- Besomi et al. (2020) · CEDE project: Amplitude normalization matrix
- PLUX · Electromyography (EMG) Sensor