What is electrodermal activity (EDA/GSR) and how is it measured?
What is electrodermal activity (EDA, GSR, galvanic skin response)? The physiology of skin conductance, measurement, SCL and SCR, artefacts and analysis.
Published
What is electrodermal activity?
Electrodermal activity (EDA) is the general name for changes in the electrical properties of the skin that follow the activity of sweat glands controlled by the sympathetic nervous system; in research it is mostly measured as skin conductance, in microsiemens (µS). The same measurement goes by several names: GSR (galvanic skin response), long common in English sources; in Turkish, “galvanik deri tepkisi” or “deri iletkenliği yanıtı”; and, in older literature, the psychogalvanic reflex. Scientific publications today use EDA as the umbrella term and speak of skin conductance, skin resistance or skin potential according to the quantity measured (Boucsein et al. 2012).
EDA is one of the oldest and most widely used measures in psychophysiology. Because it is non-invasive, relatively inexpensive and sensitive to arousal, it is one of the core signals of research on stress, emotion, decision making and user experience. But it is important to know what it measures and what it does not: EDA tracks the intensity of arousal; on its own it does not say whether a reaction is positive or negative.
Physiology: eccrine sweat glands and the sympathetic nervous system
The source of EDA is the eccrine sweat glands. These glands are especially dense on the palms and the soles of the feet, and they are driven by sympathetic nerve fibres. When sympathetic activity rises, the ducts of the glands begin to fill with sweat; because sweat is a good electrolyte, the conductance of the skin increases. This change can be measured even before sweat becomes visible on the surface of the skin.
Eccrine sweat glands have no parasympathetic control. For this reason EDA, unlike signals such as heart rate that both systems govern together, is regarded as a relatively pure indicator of sympathetic activity. The signal has two components:
- Tonic component: skin conductance level (SCL)
- The baseline that changes slowly over minutes; it relates to the person’s overall arousal at the time but can differ greatly between people.
- Phasic component: skin conductance responses (SCR)
- Short rises that typically begin 1–3 seconds after a stimulus, peak within a few seconds and decay more slowly.
- Event-related and spontaneous responses
- Responses that can be tied to a specific stimulus are called event-related SCRs (ER-SCR); those that arise without a visible stimulus are called spontaneous or non-specific SCRs (NS-SCR).
How is EDA measured?
The most common method in research is exosomatic measurement: a small voltage is applied between two electrodes and conductance is calculated from the current passing through the skin. The publication recommendations of the Society for Psychophysiological Research (SPR) recommend the constant-voltage method with a voltage of 0.5 V for skin conductance (Boucsein et al. 2012). In endosomatic measurement no external current is applied and the skin’s own potential is recorded; this method is used less often in research.
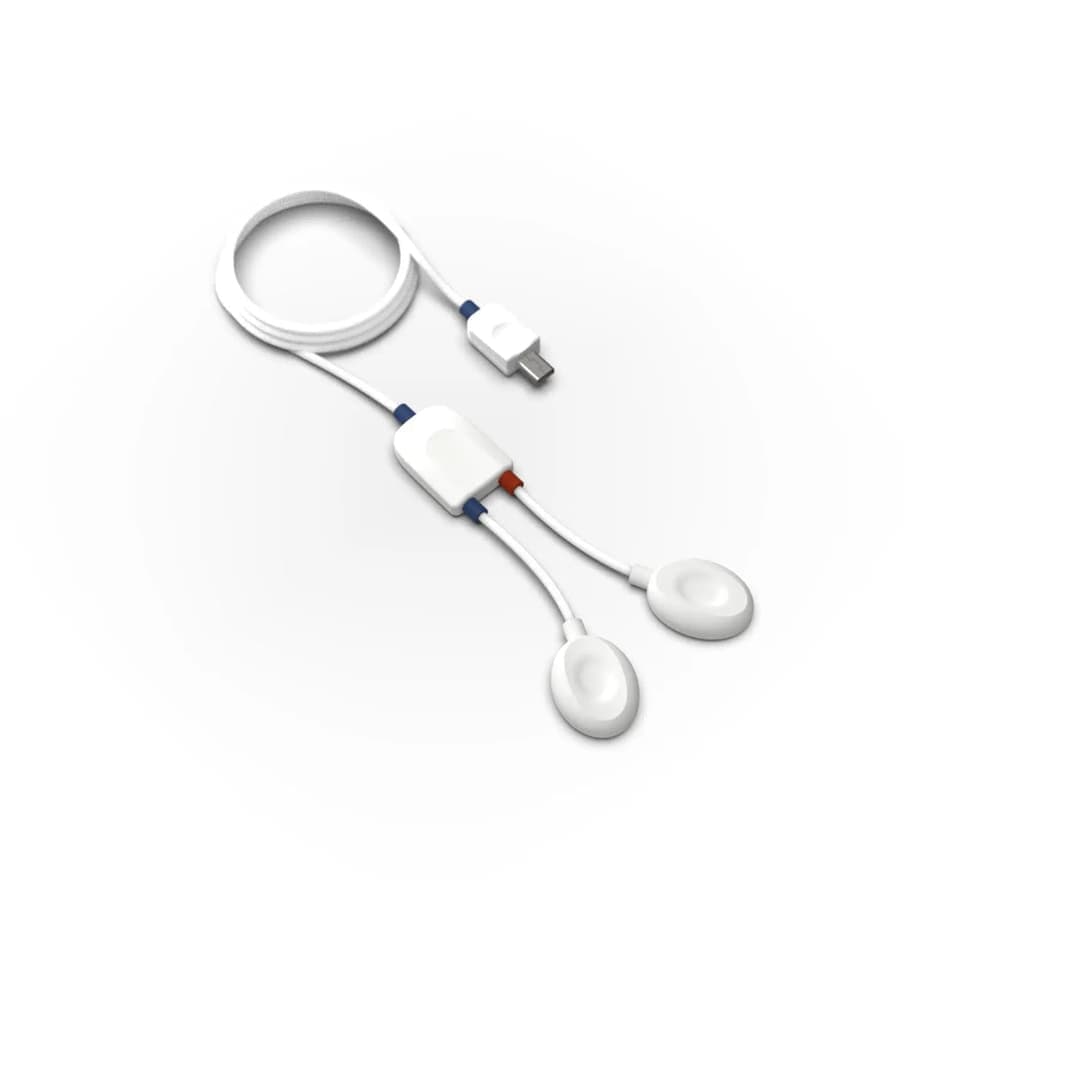
Recording usually uses Ag/AgCl electrodes and a conductive electrolyte. The recording sites are regions where eccrine glands are dense:
- Fingers: the palmar surface of the middle or distal phalanges of the index and middle fingers; the most common site.
- Palm: the thenar and hypothenar eminences below the thumb and the little finger.
- Sole of the foot: an option when the hands are needed for the task.
- Wrist, forearm and other areas: practical for wearable devices, but because gland density is lower, responses are usually weaker and less frequent.
Recording is usually made from the hand used less in the task, which reduces movement and pressure artefacts. Standard ECG gels can be high in salt and can themselves change skin conductance over long recordings, so electrolytes suited to EDA are preferred. After the electrodes are attached, it is good practice to wait about five minutes for the gel to soak into the skin, then ask the participant to take a few deep breaths and check that responses appear. Starting the recording with a 2–4 minute rest period shows both the baseline and whether the person responds at all (Braithwaite et al.).
EDA is a slow signal; the bandwidth given for PLUX’s EDA sensor is 0–3 Hz. Even so, choosing the sampling rate from this band alone is not right: measuring response latency precisely, running decomposition methods and keeping EDA in the same recording as fast signals such as EEG or ECG can call for higher sampling. The chosen rate and filters should be reported in the publication.
Which measures are reported?
EDA data are summarised with a small number of standard measures. The typical values below are for orientation only; there are large differences between people, electrode sizes and experimental conditions (Braithwaite et al.).
| Measure | Definition | Typical value or criterion | What it is used for |
|---|---|---|---|
| Skin conductance level (SCL) | The tonic baseline outside the responses | Averages mostly about 2–16 µS | General arousal; best interpreted as a difference between conditions |
| NS-SCR frequency | Number of responses per minute without a specific stimulus | Typically 1–3 per minute at rest | A second indicator of tonic arousal |
| ER-SCR amplitude | Rise of the stimulus-related response from onset to peak | Onset 1–3 s after the stimulus; minimum threshold 0.01–0.05 µS | The strength of the reaction the stimulus evokes |
| SCR magnitude | Average calculated with trials without a response counted as zero | Comes out lower than amplitude | Summarises response frequency and strength together |
| Latency and rise time | Time from stimulus to onset and from onset to peak | On the order of seconds | Examines timing differences and the shape of the response |
| Habituation | How quickly the response declines with repeated stimuli | Slope against trial number | Novelty and learning effects |
The difference between amplitude and magnitude is often confused: amplitude is the average of only those trials with a response, whereas magnitude counts trials without a response as zero. Which one is used should be reported together with the response threshold and the latency window. Because SCR distributions are skewed, square-root or logarithmic transformation is common; for comparisons between people, standardising values to the person’s own response range is another approach in use.
Artefacts and confounds
EDA is easy to record but easy to misinterpret. Anything that stimulates the sympathetic system produces a response, even if it is not the experiment’s stimulus. The main sources are these:
- Temperature
- Sweating decreases in a cold room and increases in a warm one. Keeping the laboratory at a steady temperature of about 22–24 °C and giving participants time to acclimatise is recommended.
- Movement and pressure
- Moving the hand, pressing on an electrode or pulling a cable produces sudden spikes. Because these spikes are much steeper than real responses, they can be found with slope criteria.
- Breathing, coughing and talking
- A deep breath, a sigh, a cough, a sneeze or prolonged talking produces an SCR in its own right. Marking these events during recording makes them easier to remove in analysis; recording respiration separately also helps.
- Habituation
- As the same stimulus is repeated, the response shrinks. The stimulus order should be counterbalanced in the design and the effect of the first trials assessed separately.
- Non-responders
- About one participant in ten may show no measurable EDA response; the proportion is higher in some groups. A rest recording and a simple test stimulus help to identify these people before analysis.
- Individual and daily differences
- Season, time of day and personal characteristics also affect the baseline, so it is safer to interpret SCL as a difference between conditions rather than as an absolute value.
How are EDA data analysed?
The classic method measures each response from its onset to its peak. It is simple, but when responses come close together they overlap: when a second response begins during the decay of the first, its amplitude is underestimated. Methods that separate the signal into its components were developed to overcome this:
- Ledalab and continuous decomposition analysis
- Benedek and Kaernbach (2010) separate the signal into a tonic component and a continuous phasic driver that represents the nerve activity reaching the sweat glands, so overlapping responses can be assessed individually. The method is implemented in the MATLAB-based Ledalab software.
- cvxEDA
- Greco et al. (2016) estimate the tonic and phasic components and the noise together, as a convex optimisation problem based on a physiologically plausible model.
- Filter-based decomposition
- The slow component is separated with a low-pass filter and the fast one with a high-pass filter; it is quick and available in open-source tools (for example NeuroKit2). The analysis lab on this page uses this method.
Whichever method is chosen, analysis should start with a visual check: automatic algorithms can mistake an artefact for a response or delete a genuine tonic change as drift. The response window, threshold, transformation and decomposition method should be stated clearly in the publication.
In which research is EDA used?
EDA can be used in any study that needs to follow the course of arousal over time:
- Stress and workload: mental tasks, stress protocols such as public speaking, driving and simulator studies.
- Emotion research: arousal in response to emotional images, sounds and films; together with self-report, facial expression or other measures for valence.
- Learning and fear conditioning: acquisition and extinction of the response to a conditioned stimulus.
- Decision making: responses before a choice in tasks involving risk and reward.
- User experience and neuromarketing: examining arousal in response to an interface, an advertisement or a product on the same timeline as eye tracking and EEG.
There are also studies of EDA in clinical and psychiatric contexts; these are research findings, and any assessment of an individual requires a physician’s assessment. EDA does not on its own measure “stress”, “lying” or a particular emotion; it measures change in arousal, and its interpretation depends on the experimental design.
Choosing a system for EDA measurement
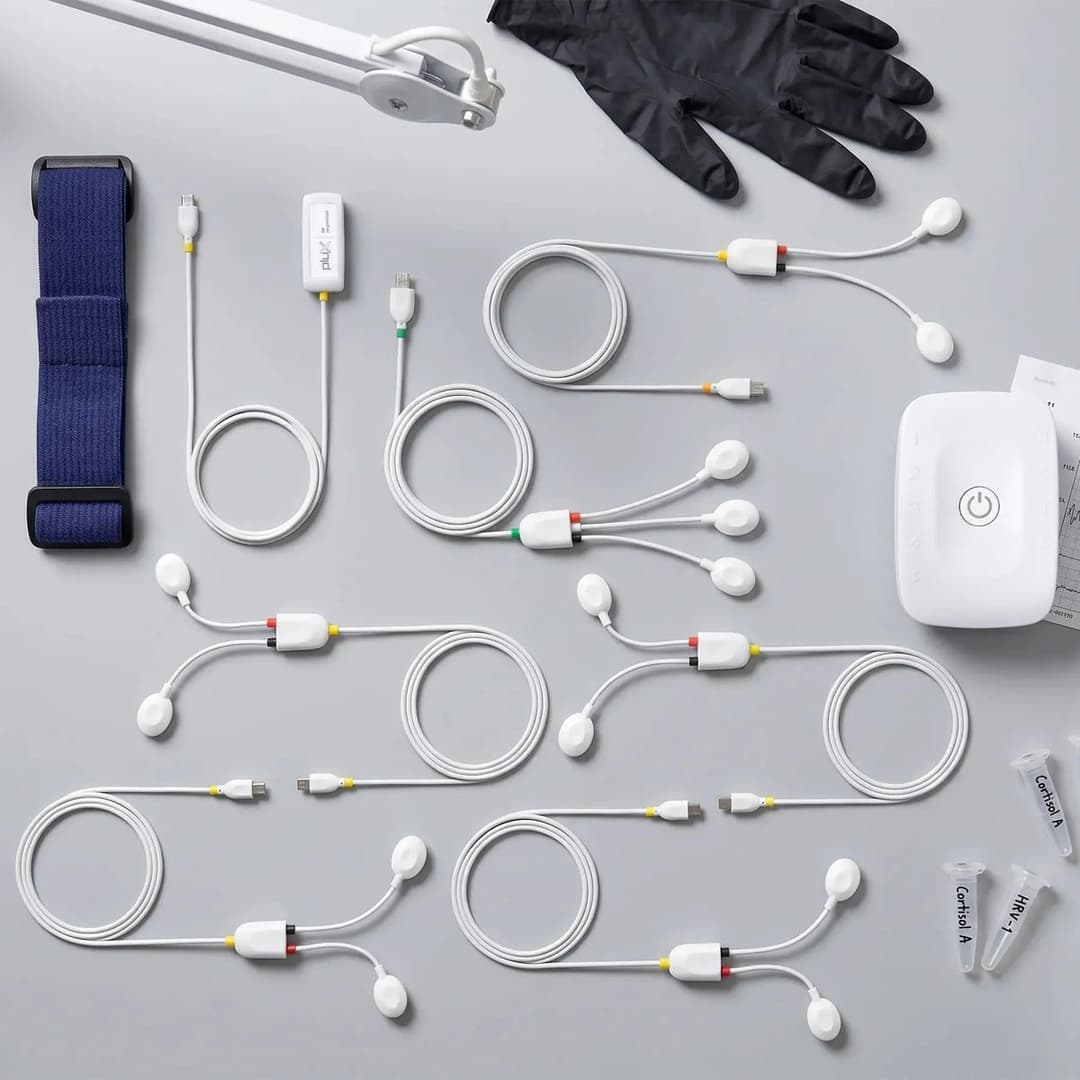
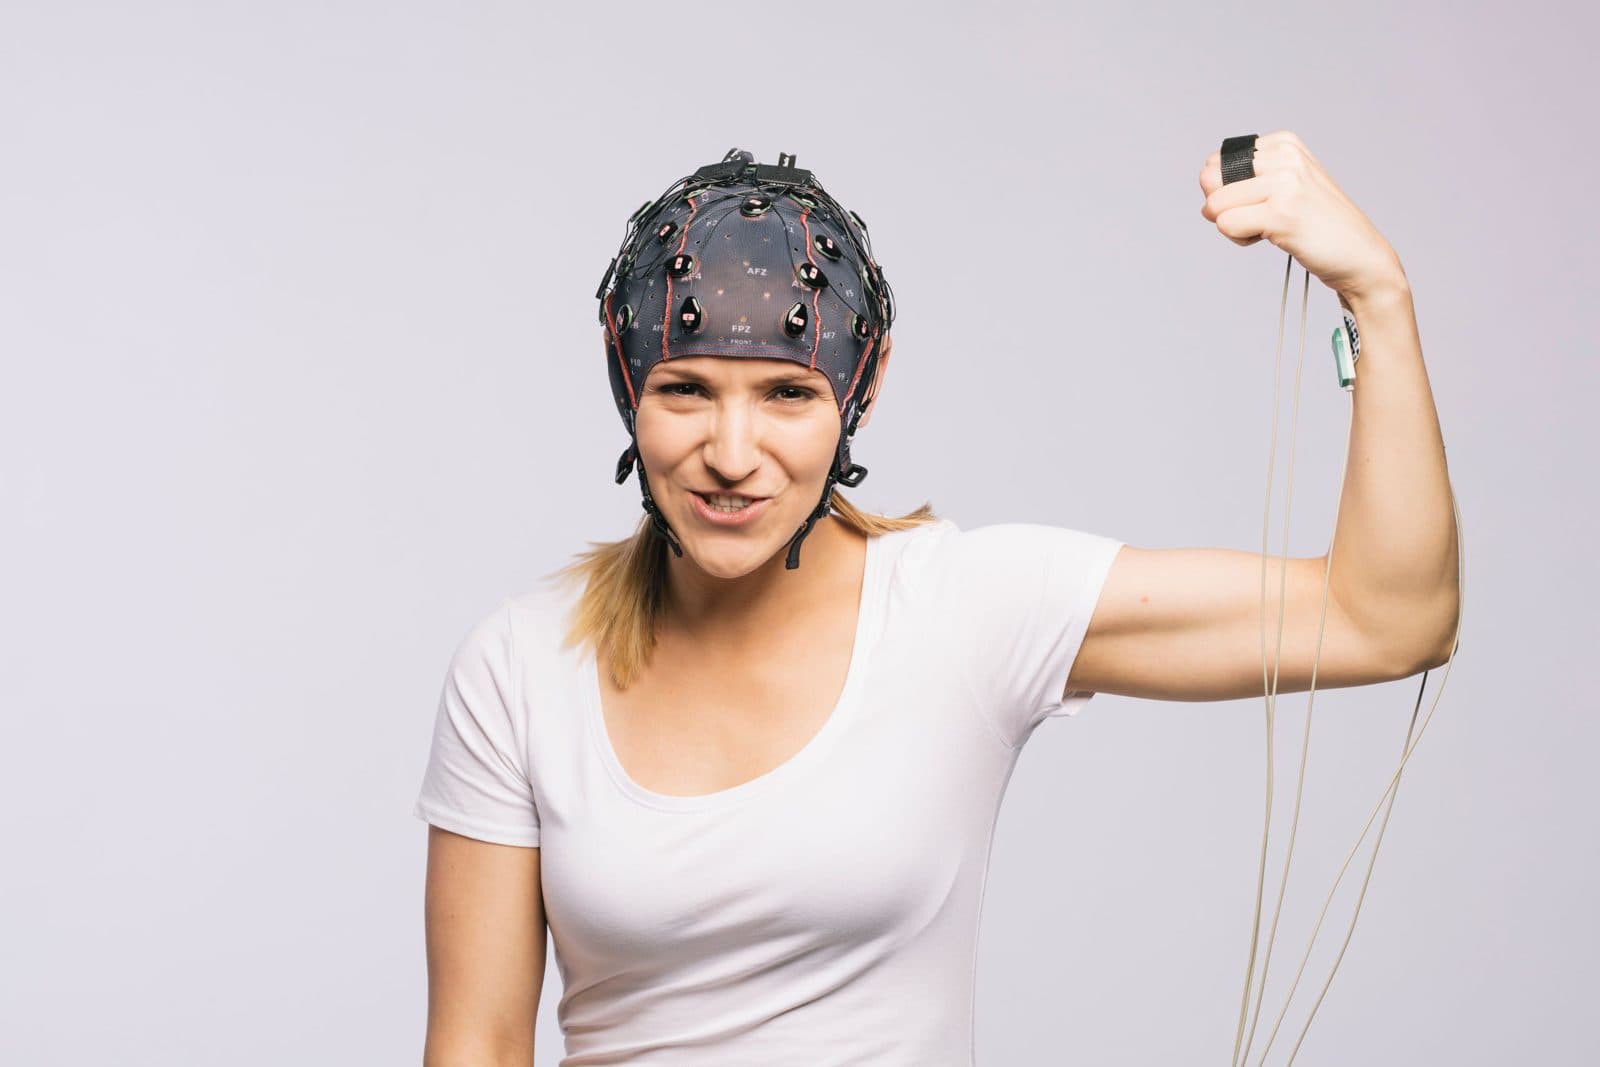
The choice depends on where the recording will take place and which signals it will be combined with. In the lab, an EDA sensor plugged into a data acquisition hub records on the same clock as ECG, respiration and EMG. Multi-sensor research kits bring the sensors together for studies such as stress and fatigue. If EEG is part of the study, an EEG amplifier with a GSR channel reduces cabling and the synchronisation burden. In courses, teaching kits are used to teach the basic concepts. Nevosa supplies the PLUX and g.tec systems listed on this page and provides installation, training and technical support. Details such as bandwidth, sampling rate and compatibility are on each product’s own page; use the quote form for a configuration that suits your study.
Explore the animation
The analysis lab processes a five-minute synthetic skin conductance recording from the hand, sampled at 32 Hz, step by step: finding and repairing movement artefacts, a low-pass filter, separating the tonic and phasic components, scoring the responses, telling sound-related from spontaneous responses, and habituation. Change the noise level and compare the results; the data are synthetic and do not come from a real participant.
From raw recording to result, every step computed.
Choose a signal and the analysis runs from start to finish on a synthetic recording built with the noise and artefacts real recordings carry. Every curve, map and number on screen is computed from that data at that step: how much the filter reduced the noise, how much of the blink ICA removed, how the ERP emerges as trials accumulate.
Raw recording
Skin conductance measured in microsiemens between two electrodes on the fingers, with twelve sudden sounds at irregular 20-28 s intervals. A slowly changing tonic level carries rapid rises, the skin conductance responses (SCRs). The raw signal also holds sharp jumps from finger movements and a moment of lost electrode contact; the lower panel shows the response to the first sound up close.
SC(t) in µS · fs = 32 Hz · 12 stimuli, numbered markersGenerating the recording and computing the analysis…
Synthetic recording · every value computed from it
Analysis steps · EDA
- 01
Raw recording
Skin conductance measured in microsiemens between two electrodes on the fingers, with twelve sudden sounds at irregular 20-28 s intervals. A slowly changing tonic level carries rapid rises, the skin conductance responses (SCRs). The raw signal also holds sharp jumps from finger movements and a moment of lost electrode contact; the lower panel shows the response to the first sound up close.
- 02
Find and repair artefacts
Skin conductance cannot change faster than a few µS per second, so any steeper slope, or a value near zero, is an artefact rather than sweat-gland activity. The lower panel shows the slope of every sample against the threshold; the shaded spans are bridged by linear interpolation. The criteria follow Kleckner et al. (2018).
- 03
Low-pass filter
A skin conductance response has almost no power above 1 Hz; what lies above is sensor noise and the steps of the 0.01 µS converter. A 1 Hz Butterworth low-pass, run forward and backward, removes them without shifting any response in time. The data are then kept at 8 Hz, which is enough for this bandwidth.
- 04
Separate tonic and phasic
The signal is split into a slow tonic level (SCL) and a fast phasic component that holds the responses. Here this is done with NeuroKit2's high-pass method: a 0.05 Hz high-pass gives the phasic part and the remainder is the tonic level. In the top panel the tonic line follows the floor of the signal; below it, each response rises from zero.
- 05
Detect responses
Every local maximum of the phasic signal is a candidate; its onset is the lowest point in the 5 s before it, and its amplitude is the rise from onset to peak. Candidates under 0.01 µS, the conventional minimum, are discarded. The lower panel shows how one response is measured: amplitude vertically, rise time horizontally.
- 06
Event-related or non-specific
A response whose onset falls 1 to 4 s after a sound is counted as elicited by that sound; all others are non-specific responses, which occur without an external trigger. The average of the phasic signal locked to the sounds builds up trial by trial, the band showing ±1 standard error. The right-hand panel gives each trial's onset latency inside the window.
- 07
Habituation
Each trial's response magnitude is listed, with zero where no response was scored, and its square root regressed on the trial number; the square-root transform is a common way to bring the skewed distribution of SCR sizes closer to normal. A negative slope means the response weakens as the sound repeats.
- 08
Summary
The recording again, with everything the analysis found: the tonic level over the conductance, and every scored response on the phasic component, those elicited by a sound and the non-specific ones in a different colour. Beside it are the measures an EDA study typically reports, here for this one participant.
The recordings are synthetic: generated with the known properties of real signals (spectrum, artefacts, response shapes) and the same on every visit. The methods are computed the way their counterparts in common tools (MNE-Python, EEGLAB, NeuroKit2, the HRV Task Force standards, Homer3) compute them. The results belong to a single synthetic participant; they are not a study's finding, a clinical assessment or a device's performance.
Frequently asked questions
What is electrodermal activity (EDA)?
Electrodermal activity is the change in the skin’s electrical properties that follows the activity of sweat glands controlled by the sympathetic nervous system. In research it is mostly measured as skin conductance, in microsiemens. It is sensitive to the intensity of arousal but does not on its own show whether a reaction is positive or negative.
Are GSR and EDA the same thing?
In practice they describe the same measurement. GSR (galvanic skin response) is an older, widespread name; scientific publications now use electrodermal activity (EDA) as the umbrella term and skin conductance for the quantity measured. Both terms can appear in product names.
Does galvanic skin response measure stress?
Not directly. EDA shows change in sympathetic arousal; stress is only one of its causes, and excitement, surprise, a deep breath or temperature also produce responses. In stress research, EDA is interpreted together with the experimental design, self-report and other measures such as heart rate.
Where are EDA electrodes placed?
The most common site is the palmar surface of the middle or distal phalanges of the index and middle fingers; the thenar and hypothenar eminences of the palm are also used. Eccrine sweat glands are dense in these areas. Wearable positions such as the wrist are more practical, but responses there are usually weaker.
What is the difference between SCL and SCR?
SCL (skin conductance level) is the tonic baseline that changes slowly over minutes. SCR (skin conductance response) is a short, phasic rise that typically begins 1–3 seconds after a stimulus. The two answer different questions and are reported separately in analysis.
References and further reading
- Boucsein et al. (2012) · Publication recommendations for electrodermal measurements (SPR)
- Boucsein (2012) · Electrodermal Activity, 2nd edition
- Braithwaite et al. · A Guide for Analysing Electrodermal Activity (EDA) & Skin Conductance Responses (SCRs), version 2.0
- Benedek and Kaernbach (2010) · A continuous measure of phasic electrodermal activity
- Greco et al. (2016) · cvxEDA: a Convex Optimization Approach to Electrodermal Activity Processing
- PLUX · Electrodermal Activity (EDA) Sensor