How is EEG recorded? A step-by-step research workflow
From preparation and electrode positioning to signal checks, recording and archiving: the essential steps of research EEG acquisition.
Before recording
A good EEG session begins before switching on the equipment. Define hypotheses, tasks, conditions and event markers; complete sampling plans, ethics approval and informed consent. Explain the task and session duration to the participant. Research EEG has no universal montage or preparation time: electrode technology, the research question and participant circumstances determine the setup.
Preparation and positioning
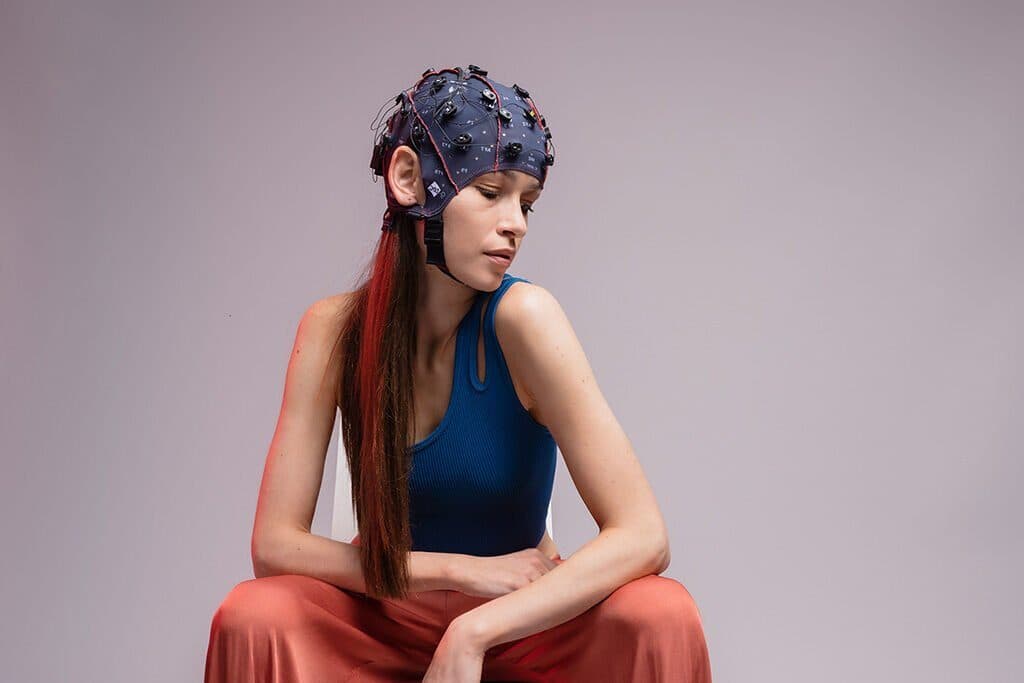
Head measurements support reproducible positioning. Systems such as 10–20 and 10–10 use anatomical landmarks. Reference and ground connections follow the device design and serve different functions.
- Measure the head and choose the cap and montage for the study.
- Place electrodes at planned positions and verify channel labels.
- Prepare skin contact and, where needed, gel according to manufacturer instructions.
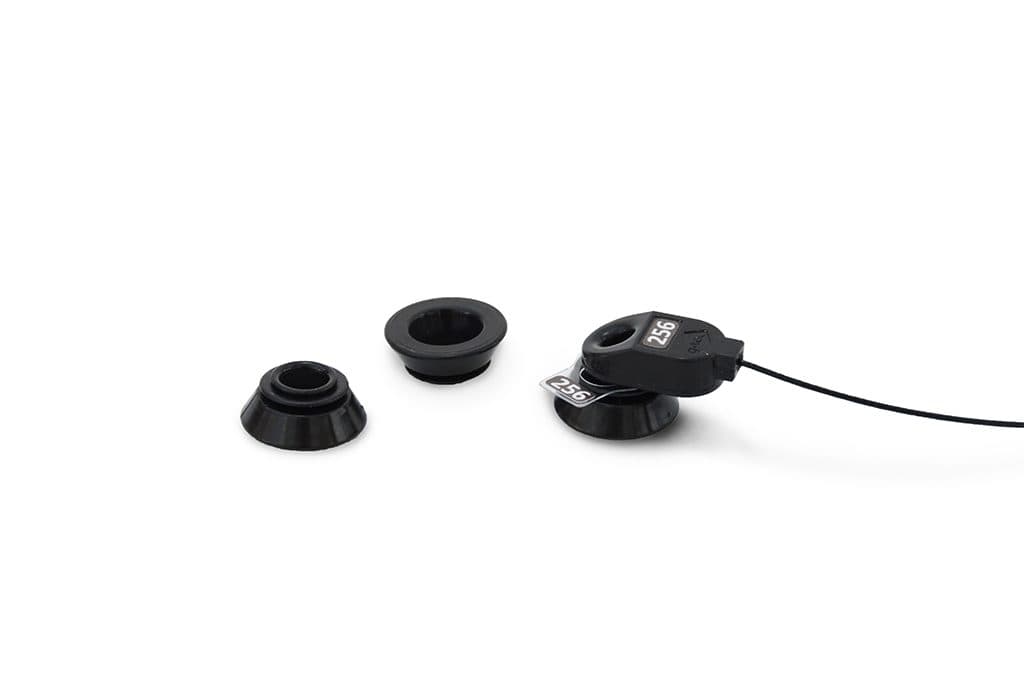
- Check impedance or contact quality using the method appropriate to the electrodes.
- Check participant comfort and strain from cables or movement.
Signal checks and acquisition
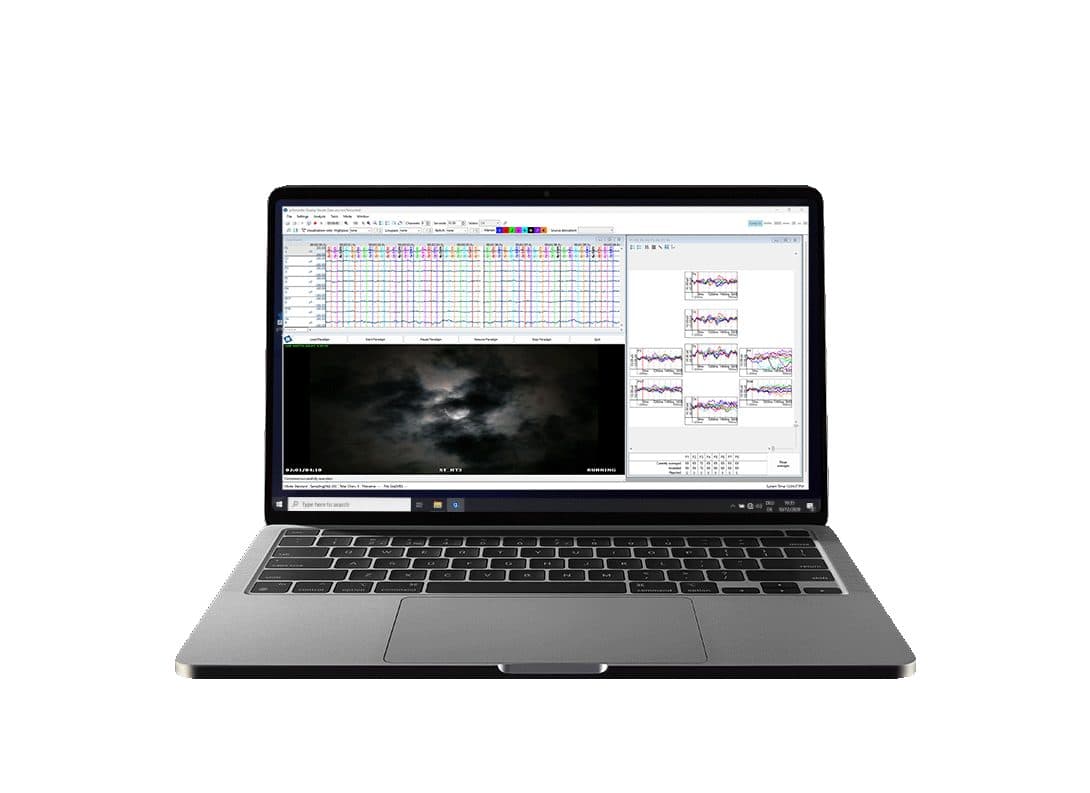
A contact-quality number alone is insufficient; inspect the raw signal. Example blinks, jaw contractions and brief movements help identify artefacts. Check flat or saturated channels, mains interference and bridged electrodes.
- Record a short pilot and inspect every channel.
- Match markers to actual stimuli and check latency and clock drift.
- Run task conditions and document interruptions, movement and session notes.
- Store raw data together with events and acquisition settings.
- Clean and disinfect equipment according to its instructions.
What should be archived?
Channel labels and positions, reference, sampling rate, hardware filters, event codes and controlled participant records are essential for analysis. Preserve raw data unchanged and version processed outputs. For g.tec EEG Turkey studies, validate software and synchronisation compatibility during a pilot session. This guide describes research acquisition; clinical EEG acquisition and interpretation are performed by the relevant healthcare professionals.
Explore the animation
Explore the origin of the signal measured by the electrode. Use the acquisition workflow alongside the device’s own operating instructions.
What is measured beneath the skull?
EEG reads the brain's electricity, fNIRS the oxygen in its blood. In one cap they answer the same stimulus on two different time scales. Switch the view, and tap the points in the drawing to see what each layer and part does.
The electric field of neurons firing together in the cortex passes through the layers to the scalp, where the electrode measures it.
Why two wavelengths?
Oxyhaemoglobin and deoxyhaemoglobin absorb near-infrared light differently: below about 800 nm HbR absorbs more strongly, above it HbO. 760 nm mostly carries the change in HbR, 850 nm the change in HbO. Measuring the attenuation at both wavelengths gives two equations in two unknowns, solved for the concentration change of each haemoglobin.
Change in light attenuation = (HbO's absorption coefficient × change in HbO + HbR's absorption coefficient × change in HbR) × source-detector distance × DPF
The modified Beer-Lambert law, once per wavelength. The DPF (differential pathlength factor) accounts for how many times longer than the distance the light's path through tissue is, because it scatters.
Curves drawn from approximate values in widely used haemoglobin absorption tables (S. Prahl).