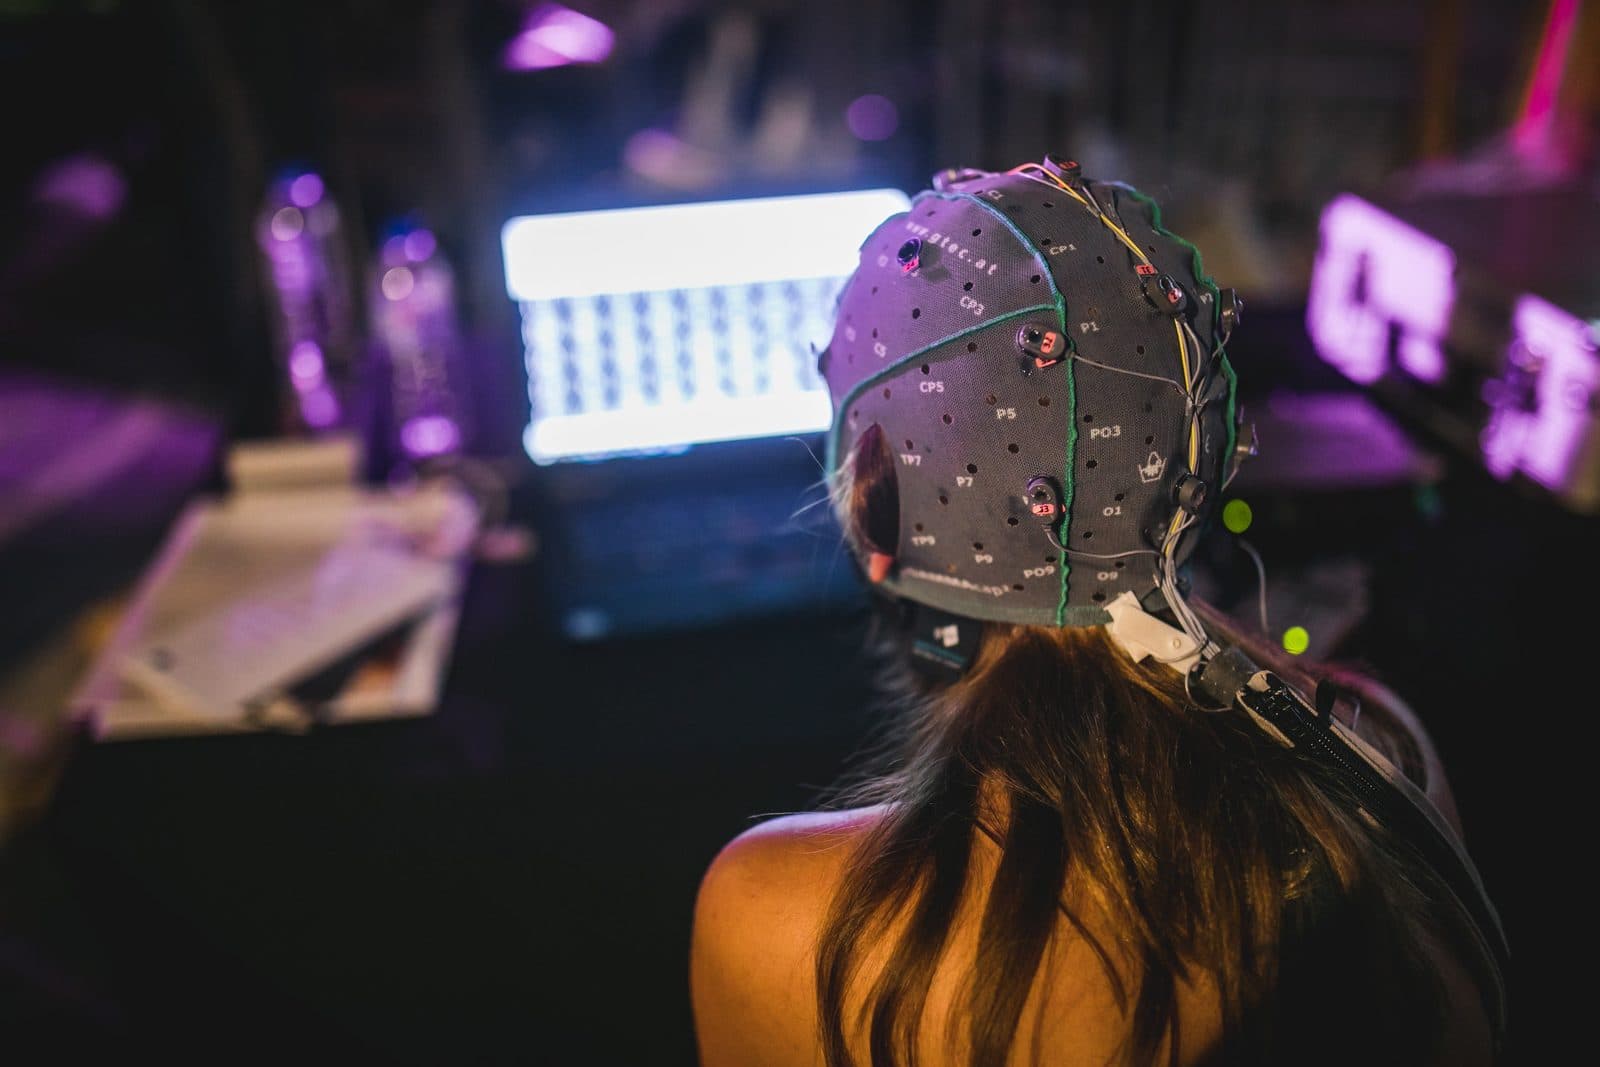
EEG analysis steps: from raw signals to spectral maps
Explore preprocessing, ICA, ERPs, spectral power, time–frequency analysis and source modelling through a step-by-step EEG animation.
Define the question and quality criteria
Analysis is not a fixed sequence of every available filter. Resting rhythms, task responses and BCI classification require different approaches. Define conditions, analysis windows, exclusion criteria and statistics in advance. Track the channels, trials and participants retained at each stage, and preserve raw data.
Preprocessing decisions
Preprocessing choices interact. Filters influence target frequencies and time-domain responses; rereferencing changes potential distributions. Unnecessary or inappropriate processing can remove useful information.
- Validate files, channels, sampling and event codes.
- Inspect raw signals and mark poor channels and corrupted intervals.
- Design filters for the research question and record their settings.
- Assess eye, muscle and movement artefacts; use methods such as ICA where appropriate.
- Review excluded components and corrected signals; ICA is not an automatic guarantee of accuracy.
- Document rereferencing and channel interpolation decisions.
- Epoch around events and apply baseline correction or trial rejection where justified.
ERP, spectral and time–frequency pathways
ERPs average time-locked trials to measure response timing and amplitude. Power spectra calculated with methods such as Welch summarise the frequency distribution of activity. Time–frequency analysis examines how activity changes during a task. Report frequency boundaries, normalisation, baseline and window length. Maps using different colour scales cannot be compared directly.
Scalp topography is different from a Brodmann map
Scalp topography interpolates electrode measurements. Assigning activity to Brodmann or other atlas regions requires source modelling: electrode coordinates, conductivity assumptions, a forward model and an inverse solution. Anatomical inputs and atlas registration affect uncertainty. The animation’s ROI maps are educational schematics; they are not actual Brodmann reconstructions calculated from its displayed spectrum.
Results and reproducibility
Compare conditions at the participant level and assess effect sizes, uncertainty and multiple comparisons. Connectivity analysis must also consider volume conduction and shared references. Preserve code, software versions, parameters and quality reports. EEG analysis consultancy in Turkey should make these decisions traceable rather than merely produce coloured plots.
Explore the animation
An oddball task's EEG recording is analysed step by step from raw to statistics: quality control, filtering, ICA, epoching, the ERP, scalp maps and spectral power. Change the noise level and compare the result of each step.
From raw recording to result, every step computed.
Choose a signal and the analysis runs from start to finish on a synthetic recording built with the noise and artefacts real recordings carry. Every curve, map and number on screen is computed from that data at that step: how much the filter reduced the noise, how much of the blink ICA removed, how the ERP emerges as trials accumulate.
Generating the recording and computing the analysis…
Synthetic recording · every value computed from it
The recordings are synthetic: generated with the known properties of real signals (spectrum, artefacts, response shapes) and the same on every visit. The methods are computed the way their counterparts in common tools (MNE-Python, EEGLAB, NeuroKit2, the HRV Task Force standards, Homer3) compute them. The results belong to a single synthetic participant; they are not a study's finding, a clinical assessment or a device's performance.