What is fNIRS? Measuring brain activity with light
Explore near-infrared light, HbO/HbR, optodes and haemodynamic responses, with fNIRS research options in Turkey.
What signal does fNIRS measure?
Functional near-infrared spectroscopy (fNIRS) measures the portion of near-infrared light reaching a detector after travelling through tissue. Oxygenated haemoglobin (HbO) and deoxygenated haemoglobin (HbR) absorb different wavelengths differently. Continuous-wave systems estimate relative haemoglobin concentration changes from intensity changes using modelling assumptions; they do not directly measure neuronal firing.
Optodes and channels
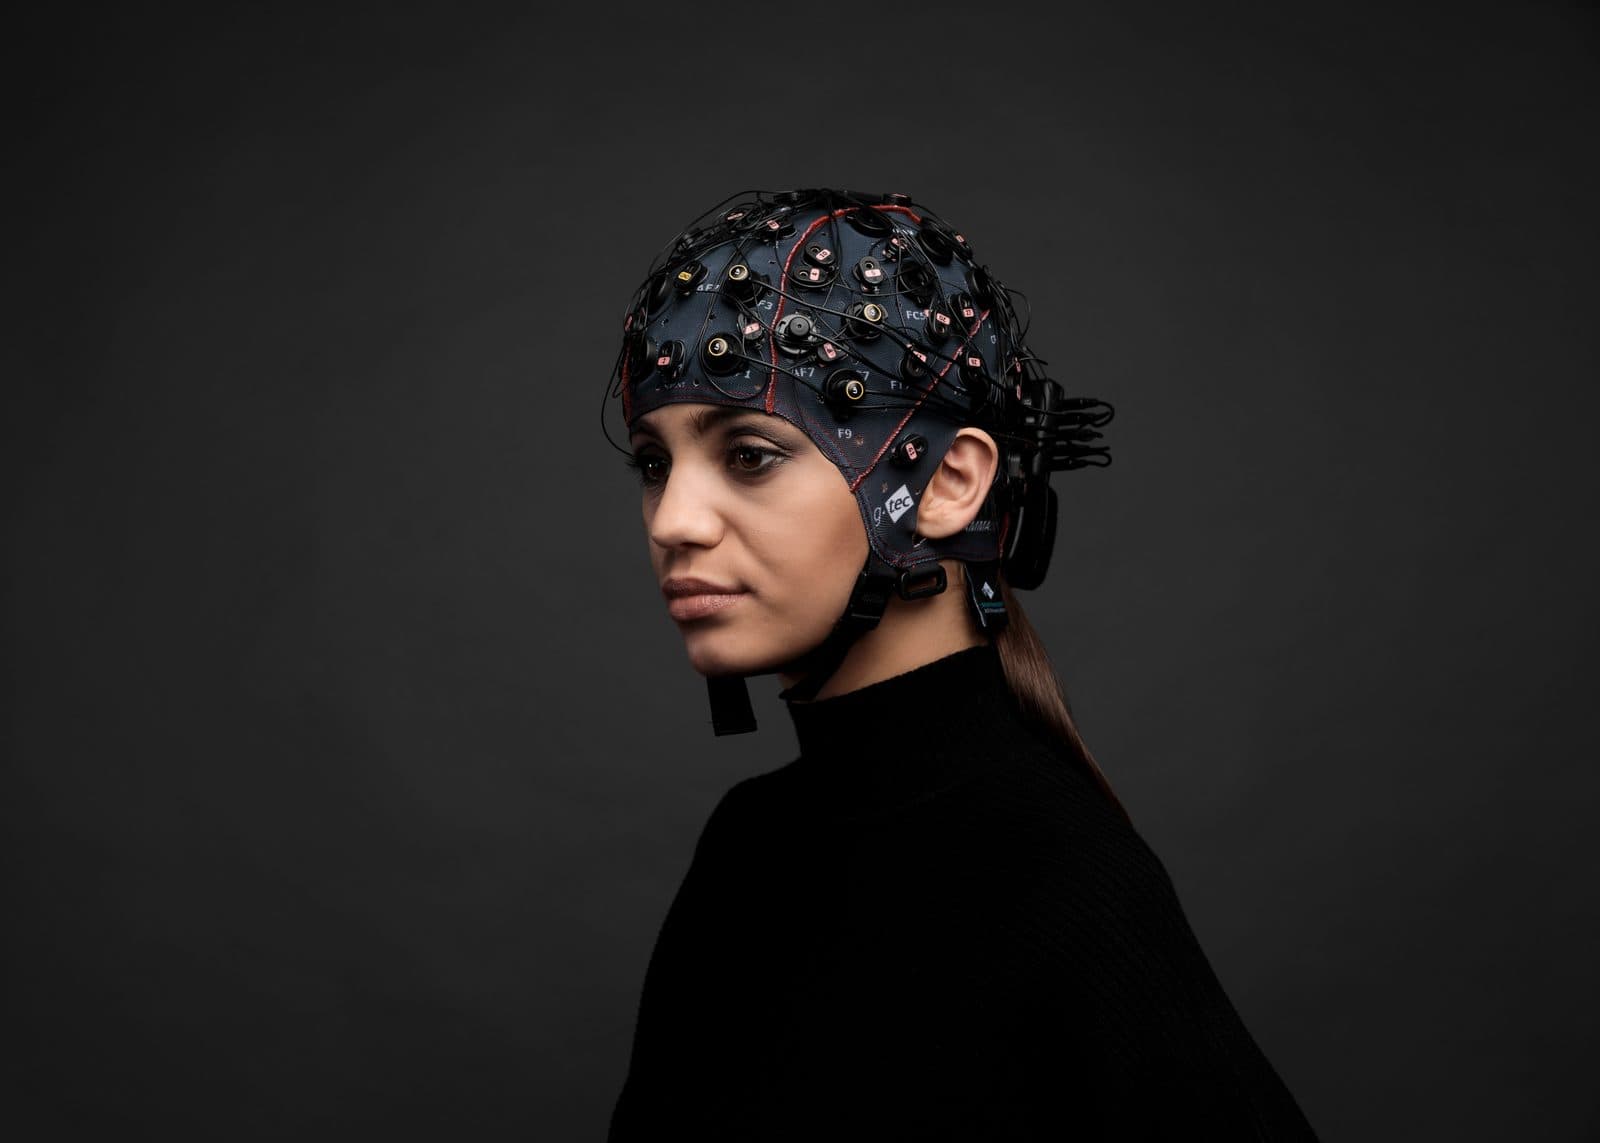
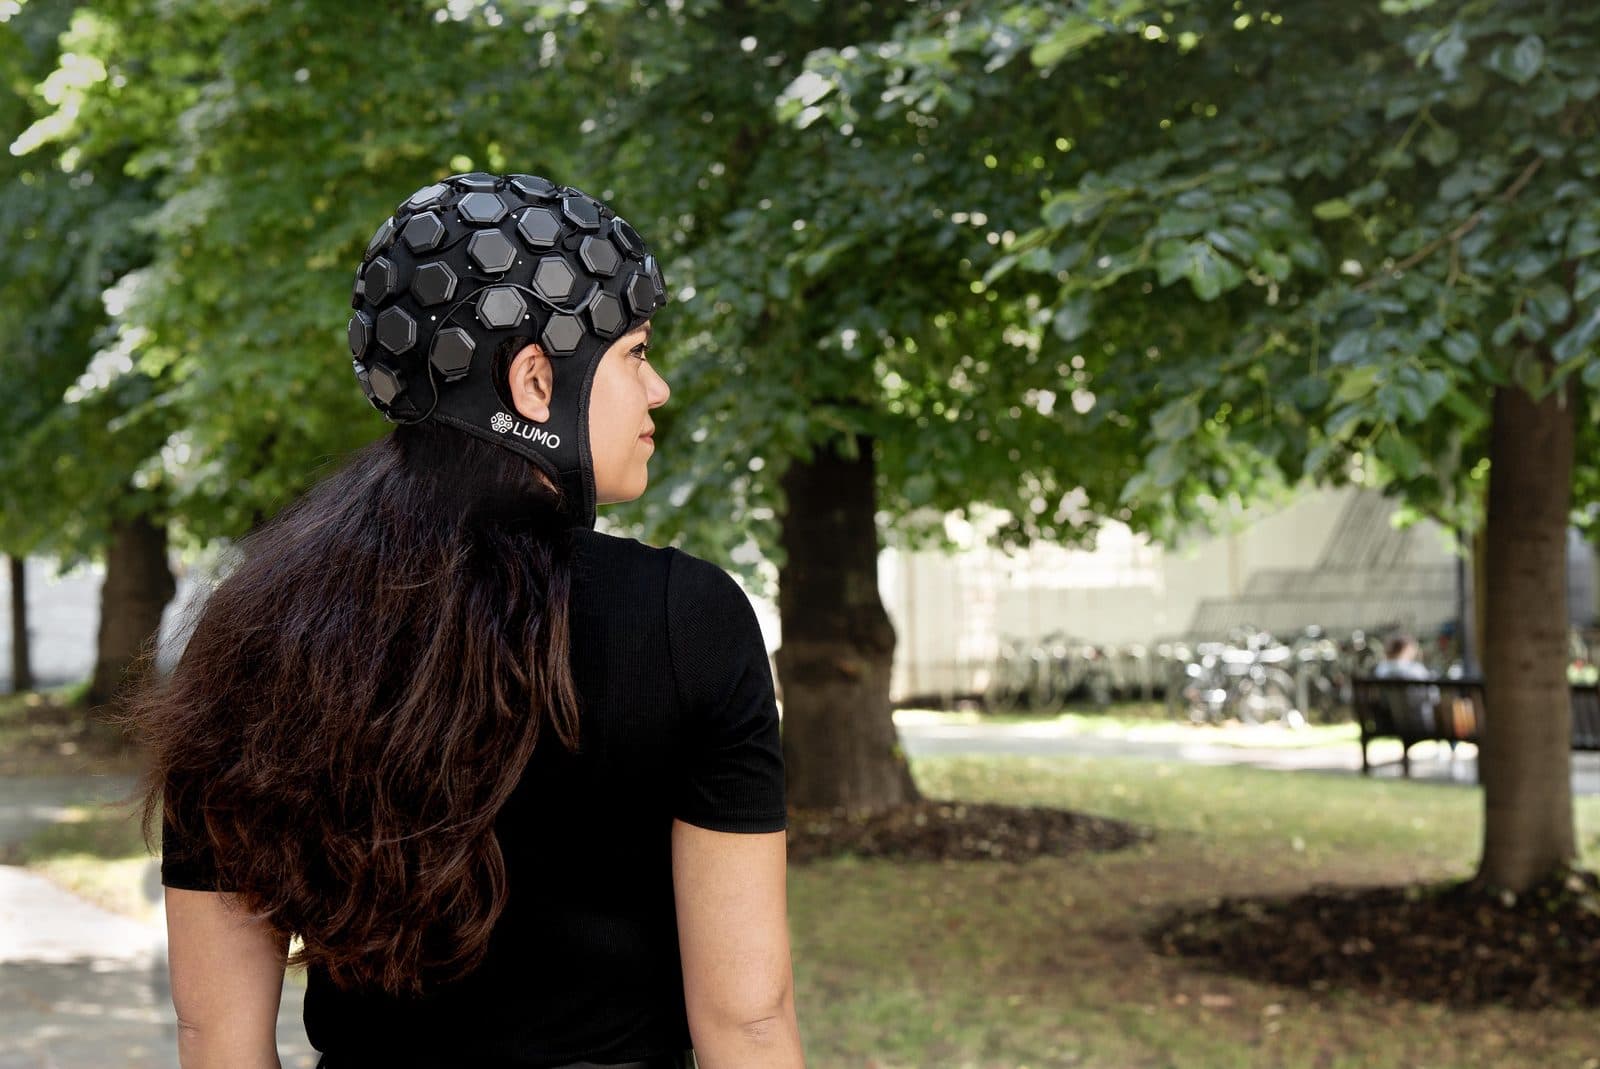
Light sources and detectors are called optodes. A source–detector pair forms a measurement channel. Their separation and head positions affect sensitivity. Hair, optical contact and movement can degrade measurements. Short-separation channels can help characterise superficial circulation, but do not automatically remove every superficial contribution.
Measurement and analysis steps
The haemodynamic response develops more slowly than an EEG response. Task durations, rest intervals and event timing should therefore suit optical measurement.
- Define the question and target cortical regions.
- Document optode positions, separations and recording geometry.
- Check optical contact and raw light intensity.
- Synchronise recordings with task markers and EEG where needed.
- Convert intensity measurements into optical density changes.
- Assess motion and superficial physiology; document the HbO/HbR conversion.
- Model task responses and report data-quality measures.
Choosing fNIRS in Turkey
Cognitive tasks, developmental studies, motor research and EEG–fNIRS acquisition require different coverage and montages. For fNIRS Turkey projects, consider geometry, short-separation measurements, movement and synchronisation before channel count. Evaluate g.tec fNIRS and Gowerlabs LUMO configurations individually. Do not expect direct imaging of deep brain structures or the same output as fMRI.
Explore the animation
Inspect the source–detector light path, short-separation channel and haemodynamic response in the animation.
What is measured beneath the skull?
EEG reads the brain's electricity, fNIRS the oxygen in its blood. In one cap they answer the same stimulus on two different time scales. Switch the view, and tap the points in the drawing to see what each layer and part does.
Near-infrared light passes through the skull, is partly absorbed by the blood in the cortex, and the light that returns to the detector is measured.
Why two wavelengths?
Oxyhaemoglobin and deoxyhaemoglobin absorb near-infrared light differently: below about 800 nm HbR absorbs more strongly, above it HbO. 760 nm mostly carries the change in HbR, 850 nm the change in HbO. Measuring the attenuation at both wavelengths gives two equations in two unknowns, solved for the concentration change of each haemoglobin.
Change in light attenuation = (HbO's absorption coefficient × change in HbO + HbR's absorption coefficient × change in HbR) × source-detector distance × DPF
The modified Beer-Lambert law, once per wavelength. The DPF (differential pathlength factor) accounts for how many times longer than the distance the light's path through tissue is, because it scatters.
Curves drawn from approximate values in widely used haemoglobin absorption tables (S. Prahl).