What are BCI studies? Brain–computer interface research
Learn motor imagery, P300 and SSVEP paradigms, from experimental design to online control and evaluation of a BCI study.
What does a BCI do?
A brain–computer interface (BCI) converts measured brain signals into outputs used for communication or control. An EEG-based BCI combines recording, processing, feature extraction, decision making and feedback. Control based on EOG or muscle activity must be distinguished from control based solely on brain signals. A BCI does not freely read every thought.
Common research paradigms
The paradigm determines the informative signal feature and the participant’s task. Training requirements, speed and comfort differ between approaches.
- Motor imagery uses changes in sensorimotor rhythms during imagined movement.
- P300 distinguishes event-related responses to target stimuli.
- SSVEP uses frequency components related to periodic visual stimulation.
- Hybrid BCI combines EEG with eye tracking, EMG or other measurements.
- Closed-loop applications return decisions to the participant as feedback.
Designing a BCI experiment
The goal might involve communication, game control, robotics or rehabilitation feedback. Offline classification accuracy alone is not sufficient to evaluate success.
- Define commands, paradigms and control conditions.
- Collect calibration data and check recording and event quality.
- Fit preprocessing and feature extraction within training data.
- Separate training and test data appropriately by session or participant.
- Evaluate the classifier with online feedback.
- Report accuracy, latency, false commands and user experience together.
Planning with g.tec and Unicorn
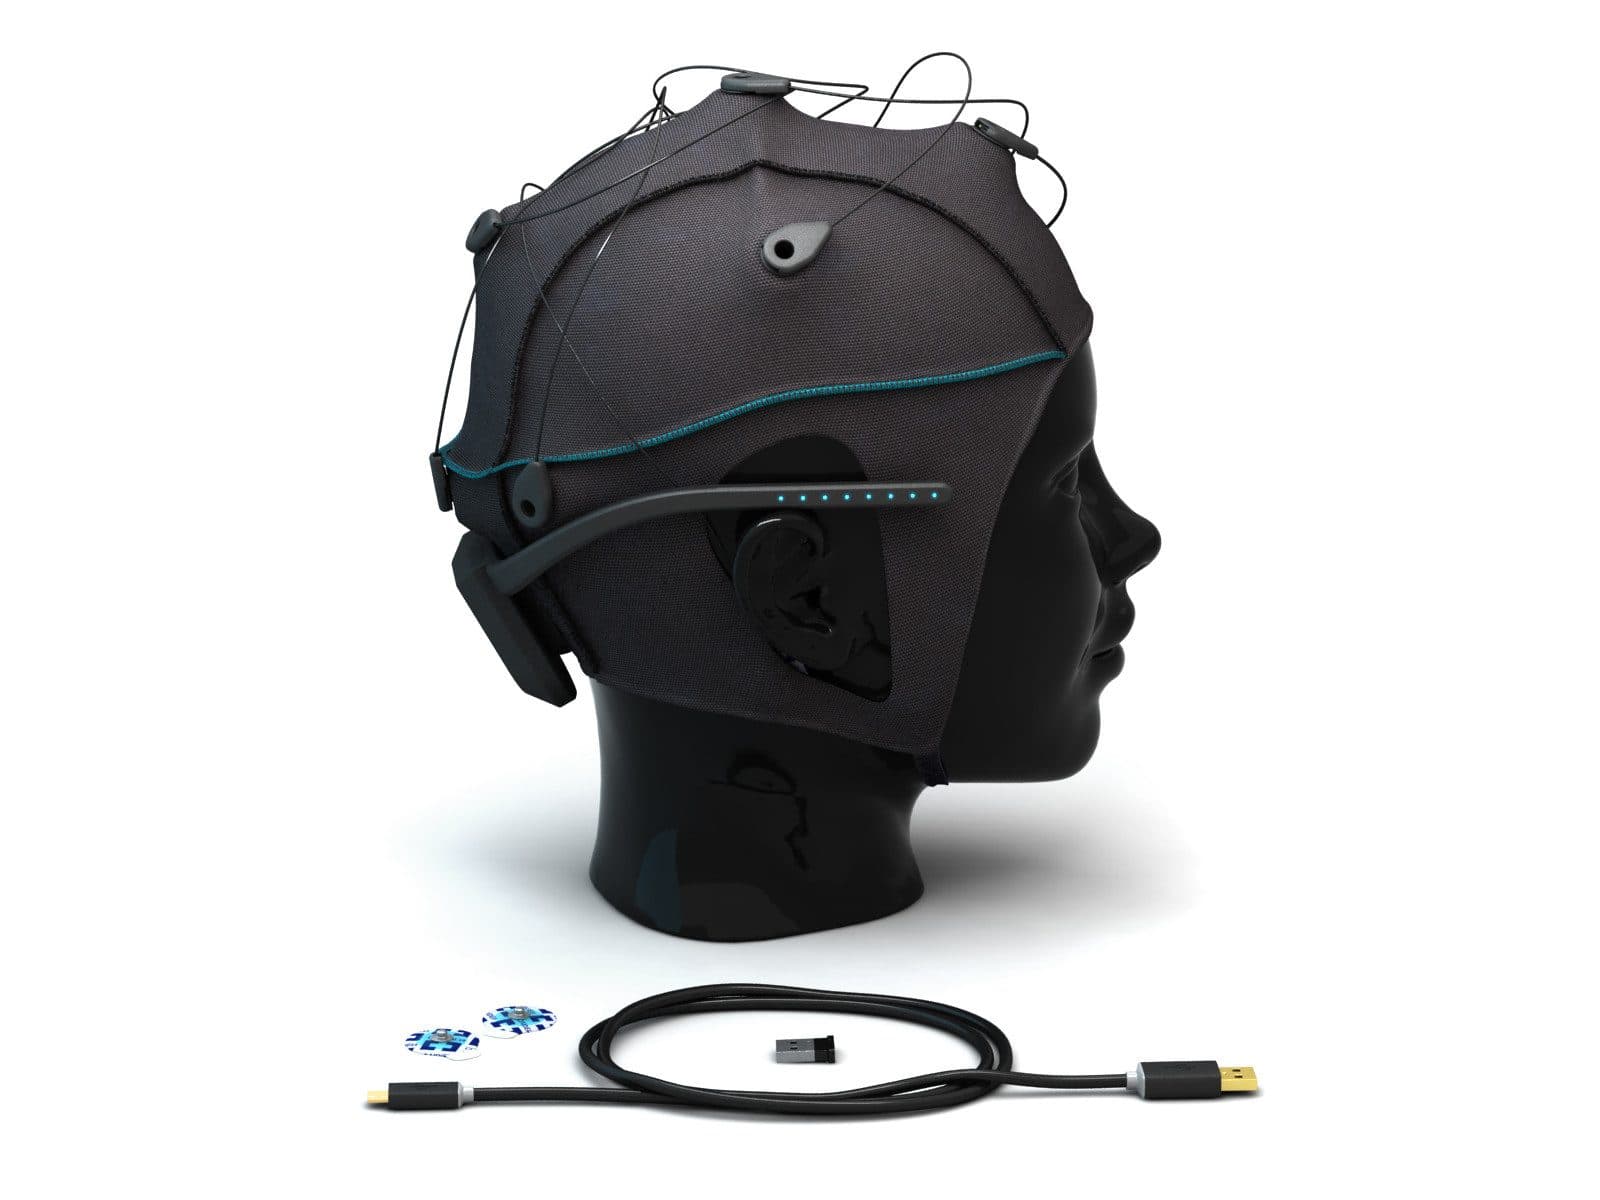
For g.tec BCI Turkey and Unicorn EEG projects, consider channel placement, software interfaces, real-time data access and event synchronisation. Communication, assistive technology, neurofeedback, artistic interaction and flight simulation studies require different tasks. Success of a research prototype is different from evidence of clinical benefit or reliable control in real-world settings.
Explore the animation
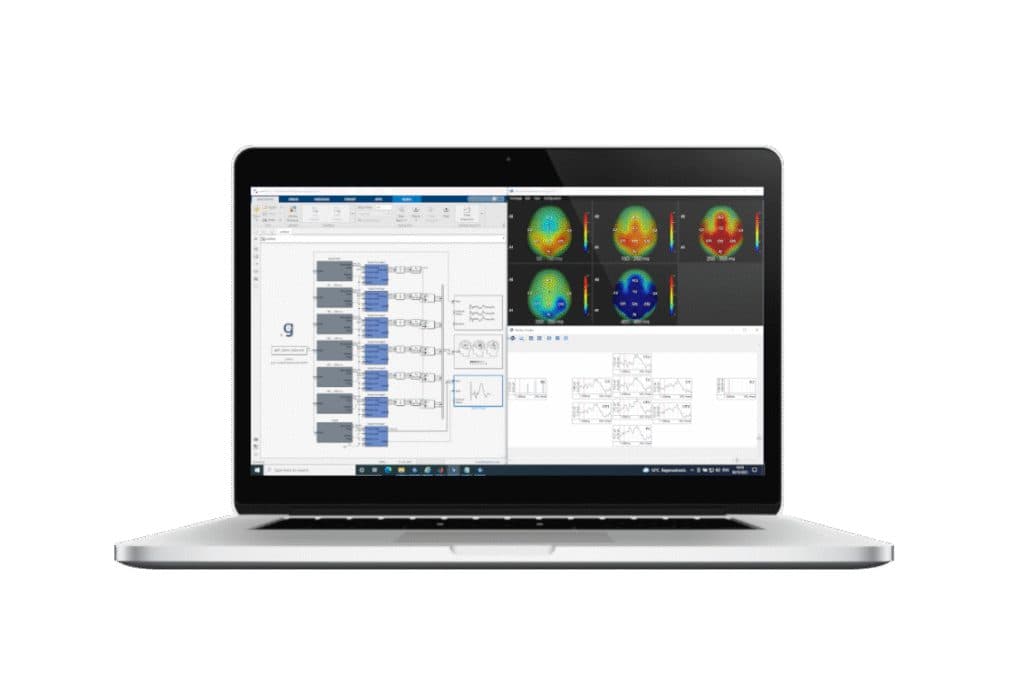
A two-class motor-imagery (left hand / right hand) calibration session is analysed step by step: ERD/ERS, the time-frequency map, CSP, LDA and cross-validation. The data are synthetic; they do not represent participant performance or product success rates.
From raw recording to result, every step computed.
Choose a signal and the analysis runs from start to finish on a synthetic recording built with the noise and artefacts real recordings carry. Every curve, map and number on screen is computed from that data at that step: how much the filter reduced the noise, how much of the blink ICA removed, how the ERP emerges as trials accumulate.
Generating the recording and computing the analysis…
Synthetic recording · every value computed from it
The recordings are synthetic: generated with the known properties of real signals (spectrum, artefacts, response shapes) and the same on every visit. The methods are computed the way their counterparts in common tools (MNE-Python, EEGLAB, NeuroKit2, the HRV Task Force standards, Homer3) compute them. The results belong to a single synthetic participant; they are not a study's finding, a clinical assessment or a device's performance.