What is HD-DOT? High-density optical brain imaging
Compare HD-DOT with fNIRS and learn overlapping optical measurements and three-dimensional reconstruction steps in the context of Gowerlabs LUMO.
The scientific term is HD-DOT
HD-DOT stands for high-density diffuse optical tomography. Like fNIRS, it relies on near-infrared light and the optical properties of haemoglobin. Many overlapping source–detector measurements and a light-propagation model are used to estimate the spatial distribution of changes within tissue. High density refers to measurement geometry and overlap, not merely the number of channels.
How does it differ from fNIRS?
Channel-level HbO/HbR time series and tomographic maps are distinct outputs. Both methods require attention to superficial physiology and optical contact. A conventional fNIRS recording does not automatically become an HD-DOT image.
| Feature | Channel-based fNIRS | HD-DOT |
|---|---|---|
| Measurement geometry | Source–detector pairs | Dense overlapping pairs, typically at multiple distances |
| Typical output | Channel-level HbO/HbR changes | Spatial changes reconstructed within a model |
| Spatial interpretation | Channel geometry and sensitivity | Geometry, head model and inverse solution together |
| Shared quality requirements | Contact, movement, superficial signals | Contact, movement, superficial signals |
How is a three-dimensional map reconstructed?
Tomography does not display measured light intensity as a photograph. A forward model predicts light propagation in tissue; an inverse solution estimates spatial changes consistent with measurements under regularisation assumptions.
- Record dense optode geometry and head positions.
- Check raw light, channel quality and usable measurement pairs.
- Calculate optical density changes and assess motion and superficial signals.
- Register optodes to anatomical data or a suitable template head model.
- Build a forward sensitivity model with tissue layers and optical properties.
- Estimate spatial changes using a regularised inverse solution.
- Calculate haemoglobin and task-model outputs; report uncertainty and coverage.
LUMO and HD-DOT research in Turkey
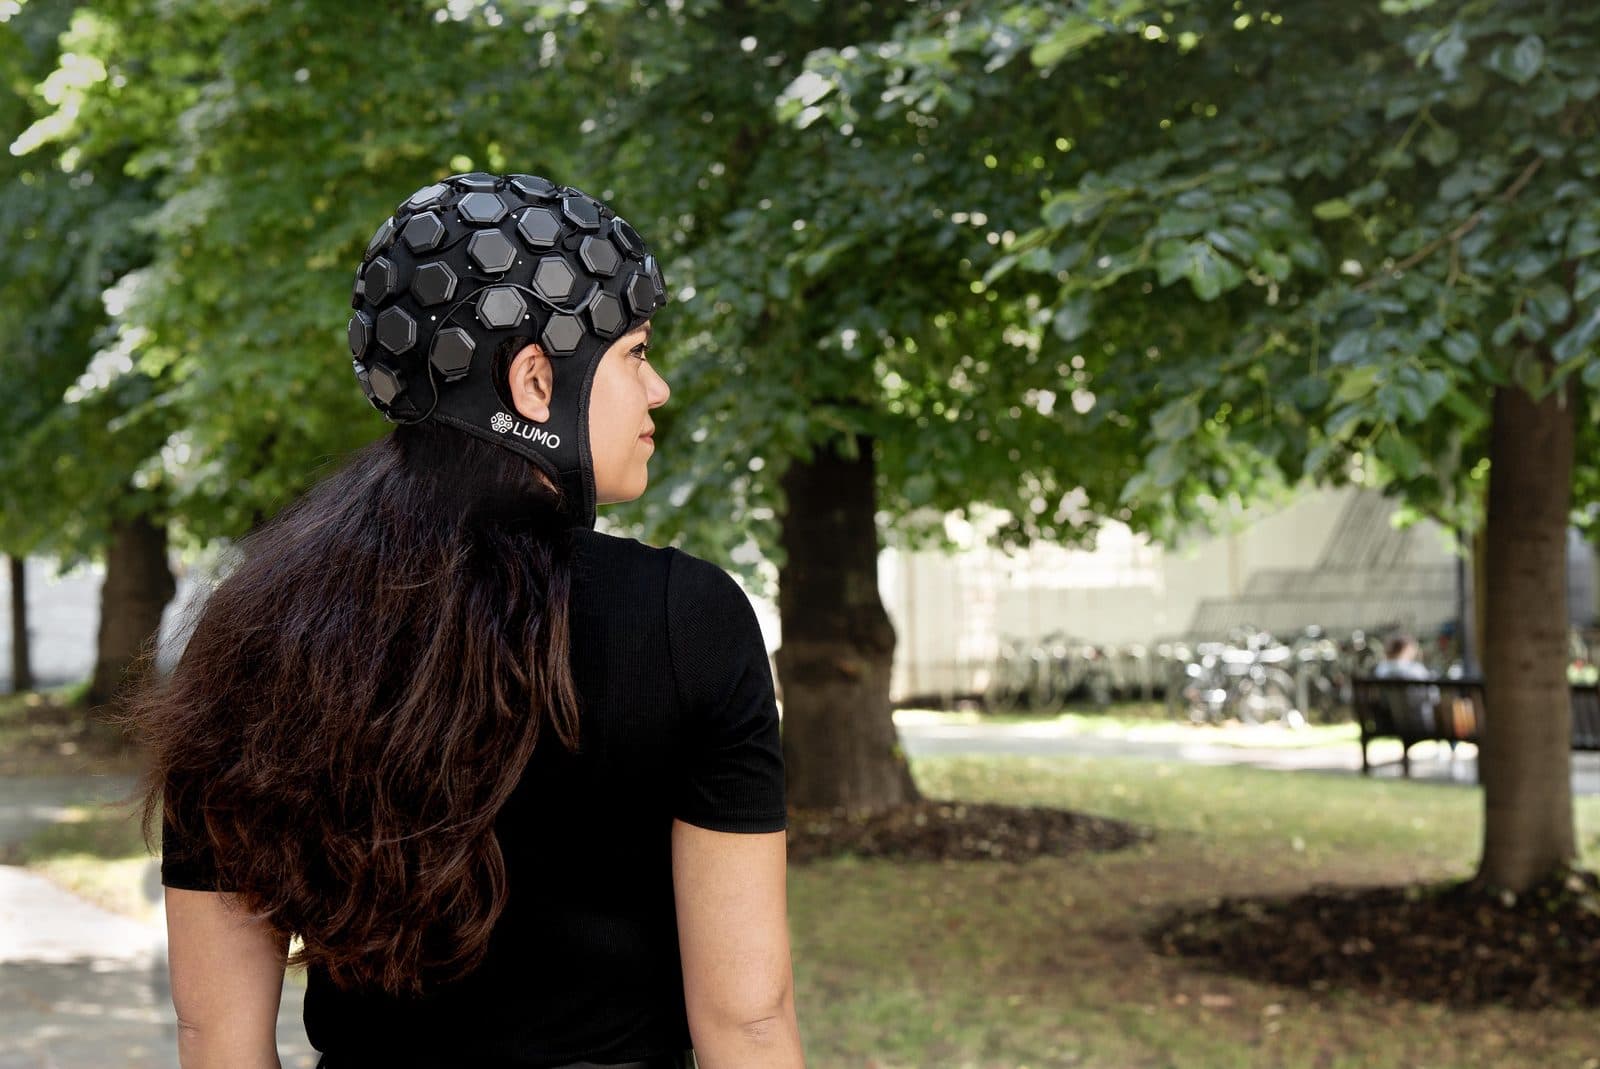
Gowerlabs LUMO is included in the catalogue’s high-density optical research systems. HD-DOT Turkey projects require separate montage and coverage planning for adults, infants or naturalistic tasks. Misregistration between optodes and head models affects maps. Tomographic output is not a direct photograph of deep brain structures; resolution and sensitivity depend on geometry, modelling and signal quality.
Explore the animation
This animation shows optical measurement physics shared with HD-DOT. It does not calculate a three-dimensional tomographic inverse solution; reconstruction steps are explained in the article.
What is measured beneath the skull?
EEG reads the brain's electricity, fNIRS the oxygen in its blood. In one cap they answer the same stimulus on two different time scales. Switch the view, and tap the points in the drawing to see what each layer and part does.
Near-infrared light passes through the skull, is partly absorbed by the blood in the cortex, and the light that returns to the detector is measured.
Why two wavelengths?
Oxyhaemoglobin and deoxyhaemoglobin absorb near-infrared light differently: below about 800 nm HbR absorbs more strongly, above it HbO. 760 nm mostly carries the change in HbR, 850 nm the change in HbO. Measuring the attenuation at both wavelengths gives two equations in two unknowns, solved for the concentration change of each haemoglobin.
Change in light attenuation = (HbO's absorption coefficient × change in HbO + HbR's absorption coefficient × change in HbR) × source-detector distance × DPF
The modified Beer-Lambert law, once per wavelength. The DPF (differential pathlength factor) accounts for how many times longer than the distance the light's path through tissue is, because it scatters.
Curves drawn from approximate values in widely used haemoglobin absorption tables (S. Prahl).