What is EEG? Measuring the brain’s electrical activity
Understand electroencephalography, electrodes, reference choices, ERPs and brain rhythms, with g.tec EEG research options in Turkey.
Where does the signal come from?
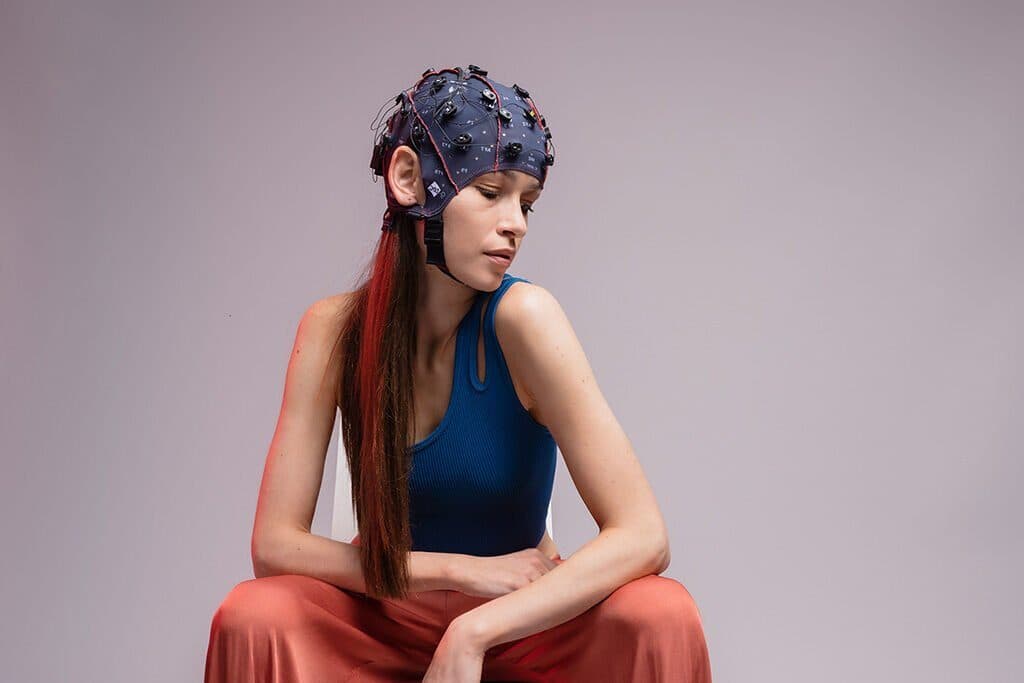
Electroencephalography (EEG) records electrical potential differences between scalp electrodes. Much of the signal relates to synchronised postsynaptic activity in cortical neuronal populations. EEG does not read an individual neuron: it records combined activity reaching the scalp through volume conduction. Millisecond temporal resolution is valuable, but a change at one electrode cannot readily be assigned to one brain region.
Electrodes, amplifiers and references
Electrodes collect signals and an amplifier makes small potential differences available for recording. Reference choice, channel montage, sampling and filters influence the data. Wet, dry and active electrodes have different preparation and recording requirements. Channel count alone does not determine recording quality or source localisation accuracy.
What can EEG produce?
Outputs depend on the experimental design and analysis method. One recording can address several questions, each requiring its own assumptions and quality checks.
- ERP: an averaged response time-locked to events.
- Spectral power: a quantitative summary within frequency ranges.
- Time–frequency analysis: changes in rhythmic activity over time.
- Topographic map: the spatial distribution of scalp measurements.
- BCI features: measurable signal properties supplied to a classifier.
Choosing a research system
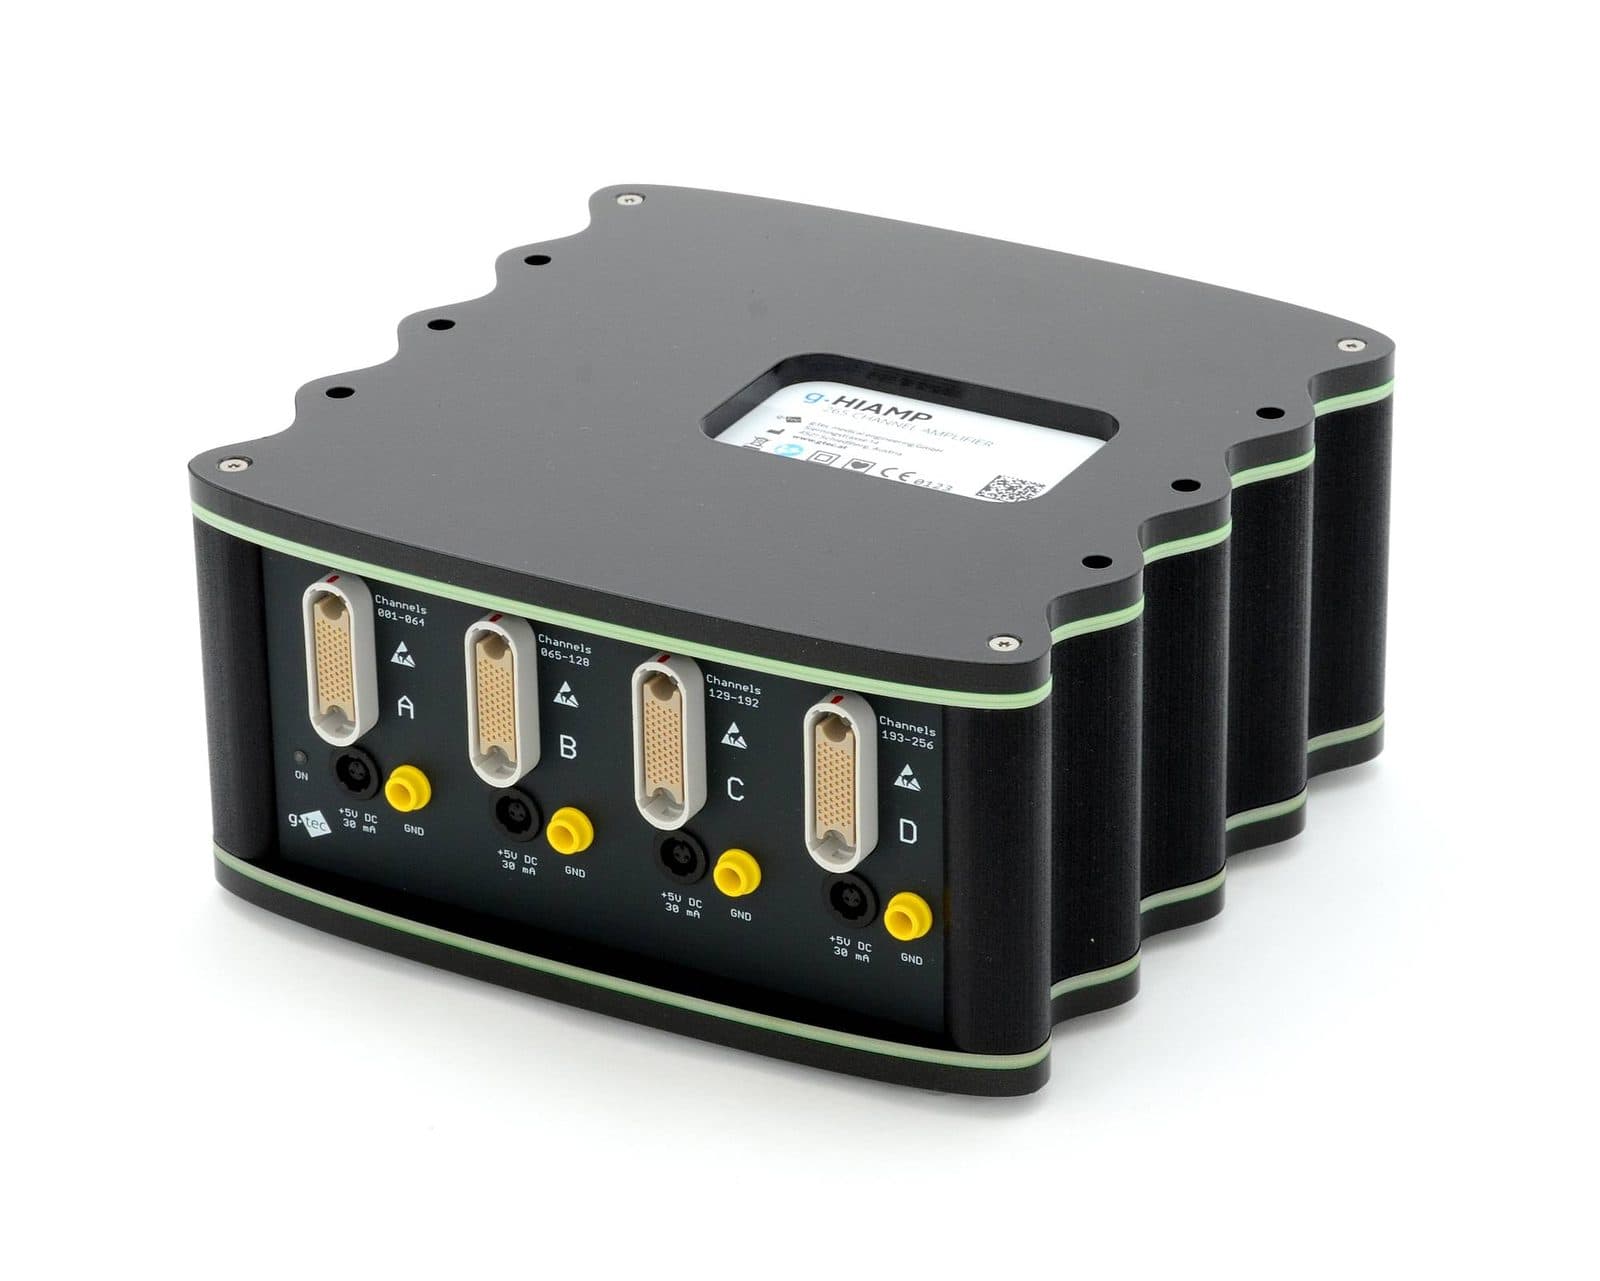
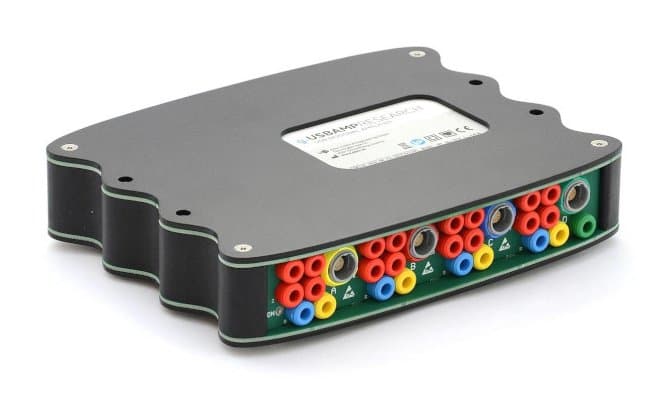
For g.tec EEG Turkey projects, consider participant movement, recording environment, electrode preparation, channel coverage and event synchronisation together. Suitability of g.Nautilus, g.HIamp and g.USBamp depends on the model’s specifications. Research EEG analysis differs from interpreting clinical EEG for diagnosis; clinical interpretation is the responsibility of a qualified physician.
Explore the animation
Select the EEG view to explore electrical fields from cortex to scalp, then compare the timing of electrical and haemodynamic measurements with fNIRS.
What is measured beneath the skull?
EEG reads the brain's electricity, fNIRS the oxygen in its blood. In one cap they answer the same stimulus on two different time scales. Switch the view, and tap the points in the drawing to see what each layer and part does.
The electric field of neurons firing together in the cortex passes through the layers to the scalp, where the electrode measures it.
Why two wavelengths?
Oxyhaemoglobin and deoxyhaemoglobin absorb near-infrared light differently: below about 800 nm HbR absorbs more strongly, above it HbO. 760 nm mostly carries the change in HbR, 850 nm the change in HbO. Measuring the attenuation at both wavelengths gives two equations in two unknowns, solved for the concentration change of each haemoglobin.
Change in light attenuation = (HbO's absorption coefficient × change in HbO + HbR's absorption coefficient × change in HbR) × source-detector distance × DPF
The modified Beer-Lambert law, once per wavelength. The DPF (differential pathlength factor) accounts for how many times longer than the distance the light's path through tissue is, because it scatters.
Curves drawn from approximate values in widely used haemoglobin absorption tables (S. Prahl).